Resources
Back

Join the AI + Data Tour for hands-on training, real customer stories, and time with Domo product experts near you.

Register now
About
Back
Awards
Recognized as a Leader for
34 consecutive quarters
Summer 2026 Leader in Embedded BI, Analytics Platforms, BI, ETL Tools, Data Preparation, and Data Governance
Pricing

Flussi di lavoro Domo

Integra e automatizza in modo intelligente i processi aziendali.

Con Domo Workflows, chiunque può semplificare i flussi di lavoro e aumentare la produttività sfruttando la potenza dei dati e dell'intelligenza artificiale.

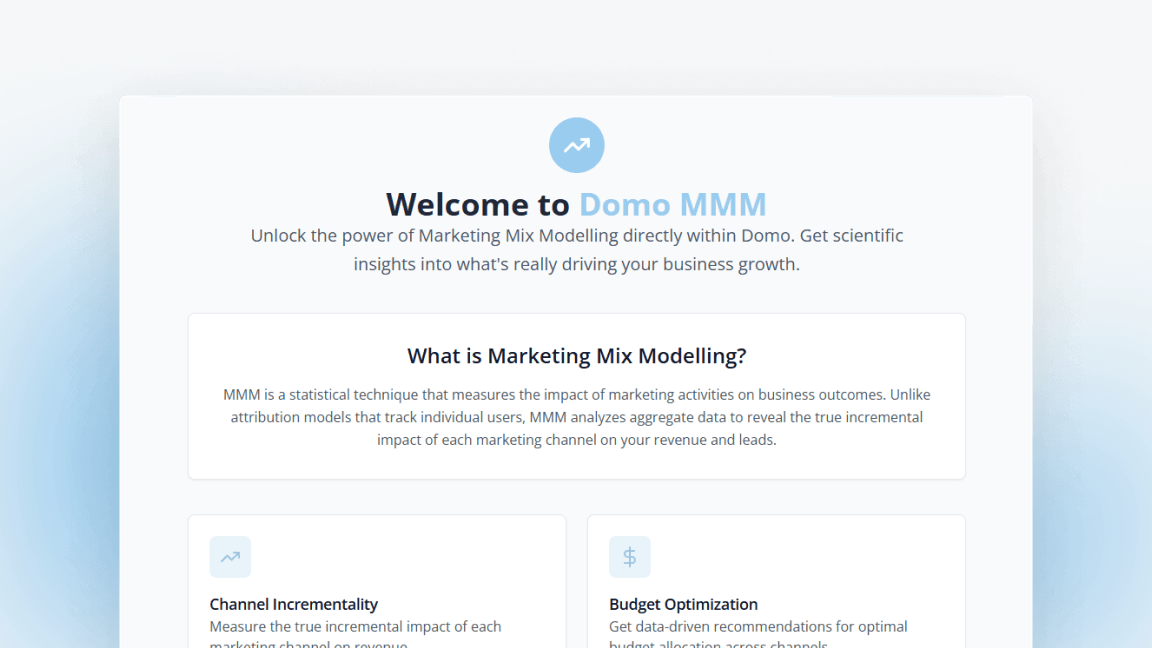
Welcome screen for Domo MMM marketing mix modeling tool explaining its purpose and benefits, including channel incrementality and budget optimization.
PANORAMICA

Libera le tue risorse con l'automazione su larga scala.

Automatizza, orchestra e integra.

Rendi le tue operazioni più efficienti, affidabili e scalabili automatizzando le attività ripetitive. Quando integri i tuoi strumenti software nei flussi di lavoro, puoi mappare i processi aziendali, eliminare i silos di dati e aumentare la produttività complessiva delle tue operazioni.
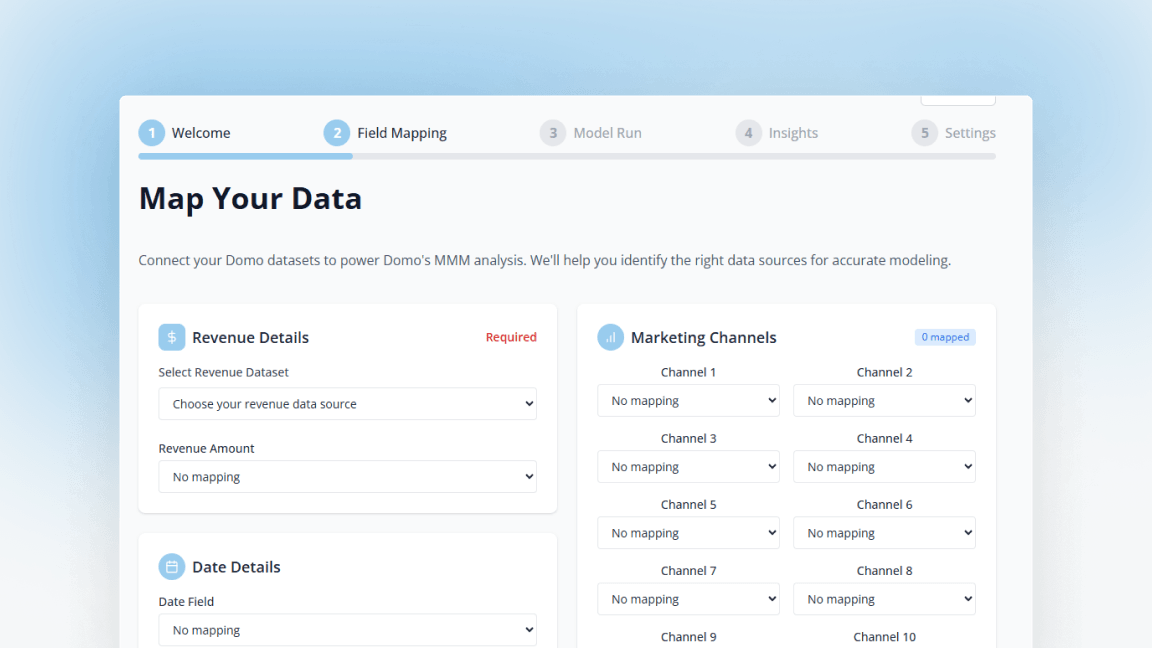
User interface screen showing field mapping step with sections for selecting revenue dataset, revenue amount, date field, and marketing channels mapping for multiple channels.

Casi d'uso

Ecco alcuni modi in cui Domo Workflows può automatizzare i processi:

Revenue waterfall chart showing incremental revenue by marketing channel, with Google PMAX showing highest increment of $21.8M and total incremental revenue of $50.2M.

Automazione dei processi

Understanding which channels drive revenue

Tablet screen showing budget planning dashboard with $50M incremental revenue, 0.86 model R², Google PMAX as top channel, 14.6% MAPE; budget allocation tab displays $8.02M total and recommended budget, $0 unallocated, $65.29M optimized revenue, and 29.9% revenue lift; model recommended budget allocation lists Google PMAX Shopping Cost $3.2M, Meta Retargeting $1.3M, and Meta Prospecting $1.1M with iROAS values.

BUDGET PLANNING

Planning next quarter's marketing spend

Problem

CFOs ask marketing leaders to justify next quarter's budget allocation, but current tools can't show how changes in channel spend affect revenue. Spreadsheets make assumptions that don't reflect how marketing actually works. Teams guess at the right budget mix rather than calculating it.

Solution

Domo MMM analyses how each channel performs at different spend levels, then recommends the optimal budget allocation. The system explains its reasoning - why it suggests reducing spend on some channels and increasing investment in others. Marketing leaders can test different scenarios, set spending limits, and plan with confidence rather than guesswork.

Tablet screen showing Stella MMM Analysis completion with model R squared 0.86, 10 channels analyzed, and $50.2M incremental revenue.

Approvazioni

Managing marketing performance across regions

Tablet screen showing MMM Insights & Recommendations with marketing mix analysis, incremental revenue $65M, model R² 0.84, top channel GOOGLE_PMAX_SH, MAPE 15.2%, and iROAS scores for various channels like Google Brand Search 14.8, Google PMAX Shopping 8.5, Meta Retargeting 8.1, Pinterest 3.5, and others with check, warning, and cross icons.

Coda per i biglietti di lavoro

Proving marketing's business impact

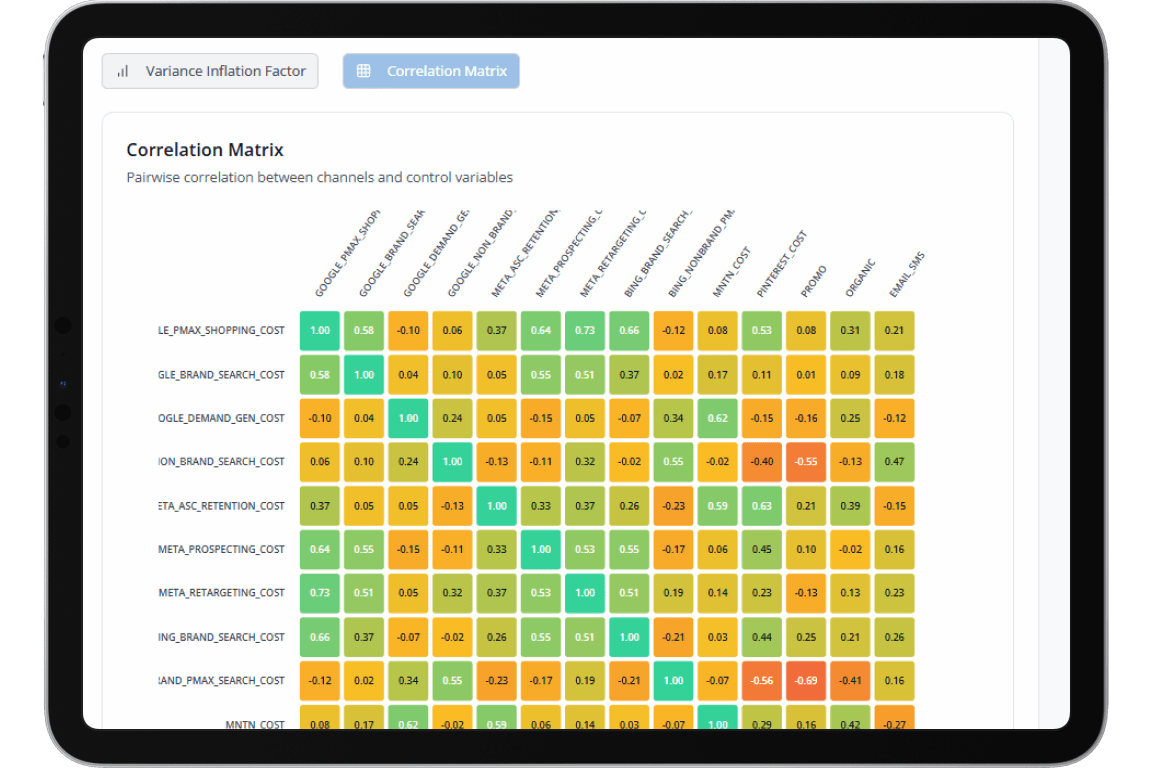
Correlation matrix table showing pairwise correlations between marketing channel costs and control variables with values color-coded from green to red.

MARKETING EFFICIENCY

Finding underperforming channels

Problem

Marketing teams continue spending on channels that may no longer deliver results because they lack reliable data. Budgets carry forward year over year without evidence that each channel still performs. Wasted spend accumulates.

Solution

With Domo MMM, channels with low or negative returns are identified automatically. The system highlights channels where additional spend delivers diminishing results and shows where budget could be reallocated. Teams make data-driven decisions to cut underperforming channels and reinvest in high-performing ones.

Budget Optimiser interface showing total budget of 300,000 for a quarter, with expected results including projected revenue of $11,554,350 and revenue lift of 95.2%.

CAMPAIGN PLANNING

Testing strategies before execution

Problem

Leadership asks questions like "what happens to revenue if we cut paid search by a third?" or "how much should we invest in brand versus performance marketing?" Teams can't answer these questions with confidence because they lack tools to test the impact of budget changes.

Solution

The Scenario Planner lets marketing leaders adjust channel budgets and see projected revenue impact. The system accounts for how effectiveness changes at different spend levels, providing data-driven answers to strategic questions. Teams plan quarterly budgets with evidence rather than spreadsheet assumptions.

Bar chart comparing current and optimized revenue results for various digital marketing channels, showing higher optimized values in most channels.

CHANNEL OPTIMIZATION

Making the most of current spend

Problem

Marketing teams know their overall budget but struggle to determine the optimal split between channels. Some channels are getting too much investment whilst others remain under-invested. Without understanding performance at different spend levels, teams can't optimize the mix.

Solution

Domo MMM analyses how each channel performs at different spend levels, showing where you get the best returns. The budget optimizer identifies channels with room to grow and channels that have hit limits. Marketing leaders reallocate spend to maximize total revenue within budget constraints.

Funzionalità

Trasforma le tue operazioni aziendali.

Automatizza in modo da poter ottimizzare.

Riduci le ore di lavoro manuale soggetto a errori e lascia che i flussi di lavoro gestiscano i passaggi ripetitivi dei tuoi processi per renderli più affidabili, scalabili ed efficienti.

Line chart of out-of-sample revenue predictions with training data, actual test values, predicted mean, 95% confidence interval, and train/test split from 2023-01 to 2024-12.

Ecco alcuni esempi di cosa puoi automatizzare con i flussi di lavoro:

A dollar bill

Modifica i prezzi in base ai trigger dinamici.

A bar graph with an arrow going up

Aggiorna le tue previsioni di vendita in base alle tendenze e avvia senza problemi le modifiche dopo aver ricevuto l'approvazione.

A checkmark inside a scalloped circle

Risparmia denaro verificando automaticamente gli utenti dell'account e disabilitando gli account inattivi nel sistema di origine.

An exclamation point inside a circle icon

Rileva automaticamente le anomalie nei tuoi dati, crea un ticket di supporto e avvisa le parti interessate.

Orchestra i passaggi e le azioni.

I tuoi processi aziendali complessi si basano sul coordinamento di numerose attività, attività e risorse. L'orchestrazione dei processi aziendali aiuta ad aumentare l'efficienza, ridurre i costi e migliorare le prestazioni complessive.

MMM Insights & Recommendations dashboard showing $50M incremental revenue, 0.86 model R², Google as top channel, 14.6% MAPE, and iROAS performance metrics for various marketing channels with status indicators.

Workflows ti offre gli strumenti per:

A tree chart icon

Mappate i processi aziendali, compresi chi e cosa è coinvolto.

A checkmark in a dashed box icon

Definisci quali azioni devono essere intraprese in base ai dati in diversi punti del processo.

A bar graph with a magnifying glass on it

Collega le azioni degli utenti in modo che tutti rimangano concentrati.

A bell icon

Avvisa le parti interessate all'interno e all'esterno dell'azienda su cosa fare e quando.

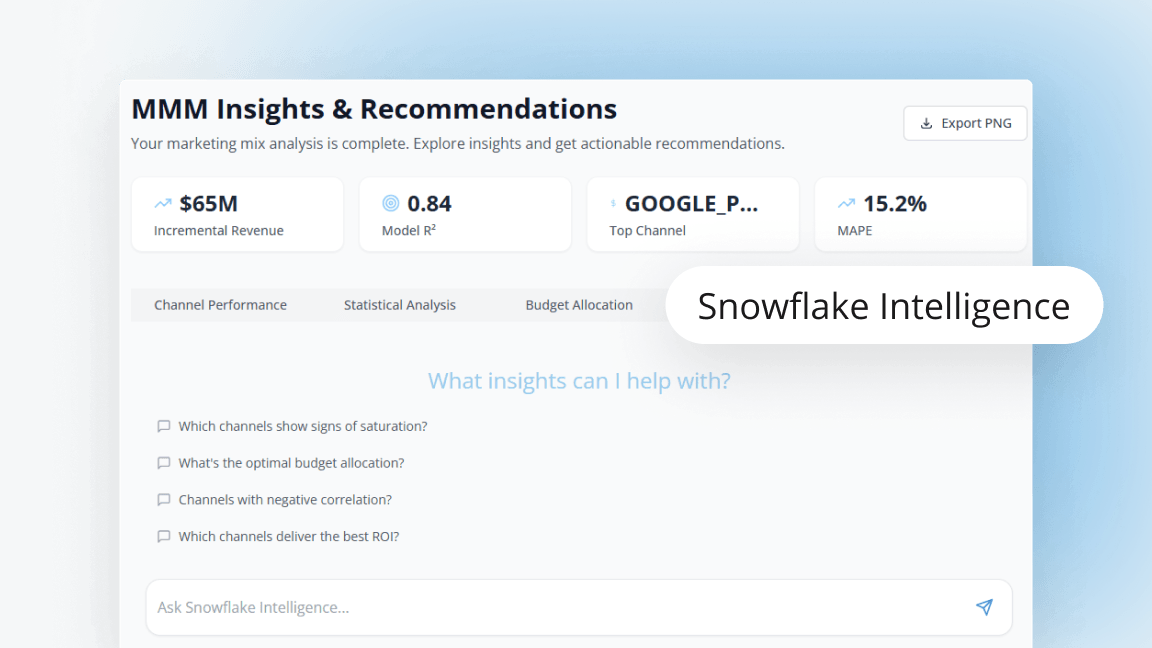
Dashboard showing MMM Insights & Recommendations with $65M incremental revenue, 0.84 model R squared, Google as top channel, and 15.2% MAPE, plus questions for Snowflake Intelligence assistant.

Ecco alcuni esempi di cosa puoi integrare con i flussi di lavoro:

‍

A data collection icon

Strumenti di analisi web

A line diverging into two arrow lines with a plus sign above it

Piattaforme dati

A computer icon

Sistemi di e-commerce

Gear icon

Piattaforme CRM

A store icon

Sistemi di prenotazione viaggi

A cylinder in a house

Piattaforme di email marketing

A bar graph with a magnifying glass on it

Sistemi di fatturazione

A dollar bill

Piattaforme CRM

Integrazione Domo

Sblocca tutta la potenza di Domo con Workflows

Domo offre una serie di strumenti che completano e aumentano le funzionalità presenti all'interno dei flussi di lavoro.

Flow chart icon

Approvazioni

Avvia un flusso di lavoro dall'interno di un

A bar graph under an up arrow

Avvisi

Usare

A USB icon

Funzioni cloud

Una libreria di funzioni popolari semplifica ulteriormente la creazione di flussi di lavoro.

Icon of a hand holding a phone

App aziendali

Integra i flussi di lavoro con eventi e trigger che si verificano all'interno

Two database icons

Flussi di dati

Ottimizza e automatizza i tuoi flussi di dati.

A circle with a check mark in front of a circle with an "x"

Set di dati

Automatizza l'aggiornamento o l'esportazione dei set di dati.

Risorse

Scopri le possibilità dei flussi di lavoro consultando le nostre guide pratiche.

An X in a circle