Recursos
Atrás

Únete al AI + Data Tour para recibir formación práctica, conocer historias reales de clientes y pasar tiempo con los expertos en productos de Domo cerca de ti.

Regístrate ahora
Sobre nosotros
Atrás
Premios
Reconocido como líder durante
34 trimestres consecutivos
Líder en verano de 2026 en BI integrado, plataformas de análisis, BI, herramientas ETL, preparación de datos y gobernanza de datos
Precios

Flujos de trabajo de

Integre y automatice de forma inteligente los procesos empresariales.

Con Domo Workflows, cualquier persona puede optimizar los flujos de trabajo y aumentar la productividad, al tiempo que aprovecha el poder de los datos y la IA.

Welcome screen for Domo MMM marketing mix modeling tool explaining its purpose and benefits, including channel incrementality and budget optimization.
VISIÓN GENERAL

Libere sus recursos con la automatización a escala.

Automatice, organice e integre.

Haga que sus operaciones sean más eficientes, confiables y escalables automatizando las tareas repetitivas. Al integrar las herramientas de software en los flujos de trabajo, puede planificar sus procesos empresariales, eliminar los silos de datos y aumentar la productividad general de sus operaciones.
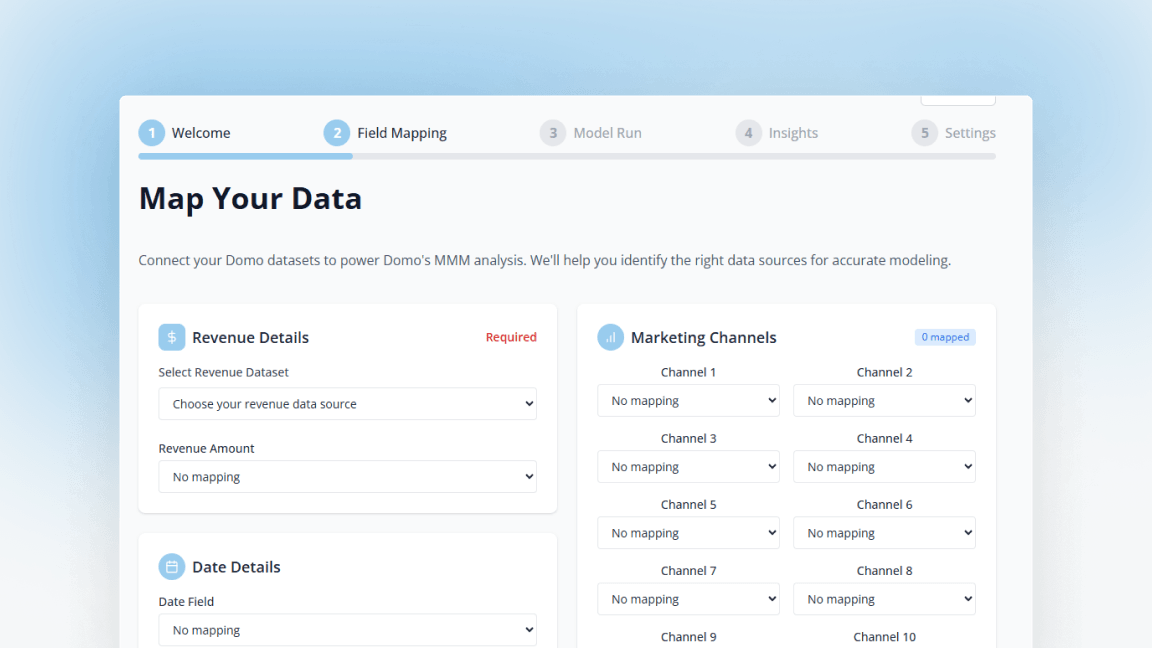
User interface screen showing field mapping step with sections for selecting revenue dataset, revenue amount, date field, and marketing channels mapping for multiple channels.

Casos de uso

Estas son solo algunas de las maneras en las que los flujos de trabajo de Domo pueden automatizar los procesos:

Revenue waterfall chart showing incremental revenue by marketing channel, with Google PMAX showing highest increment of $21.8M and total incremental revenue of $50.2M.

Automatización de procesos

Understanding which channels drive revenue

Tablet screen showing budget planning dashboard with $50M incremental revenue, 0.86 model R², Google PMAX as top channel, 14.6% MAPE; budget allocation tab displays $8.02M total and recommended budget, $0 unallocated, $65.29M optimized revenue, and 29.9% revenue lift; model recommended budget allocation lists Google PMAX Shopping Cost $3.2M, Meta Retargeting $1.3M, and Meta Prospecting $1.1M with iROAS values.

Gobernanza

Planning next quarter's marketing spend

Tablet screen showing Stella MMM Analysis completion with model R squared 0.86, 10 channels analyzed, and $50.2M incremental revenue.

Aprobaciones

Managing marketing performance across regions

Tablet screen showing MMM Insights & Recommendations with marketing mix analysis, incremental revenue $65M, model R² 0.84, top channel GOOGLE_PMAX_SH, MAPE 15.2%, and iROAS scores for various channels like Google Brand Search 14.8, Google PMAX Shopping 8.5, Meta Retargeting 8.1, Pinterest 3.5, and others with check, warning, and cross icons.

Lista de tickets de trabajo

Proving marketing's business impact

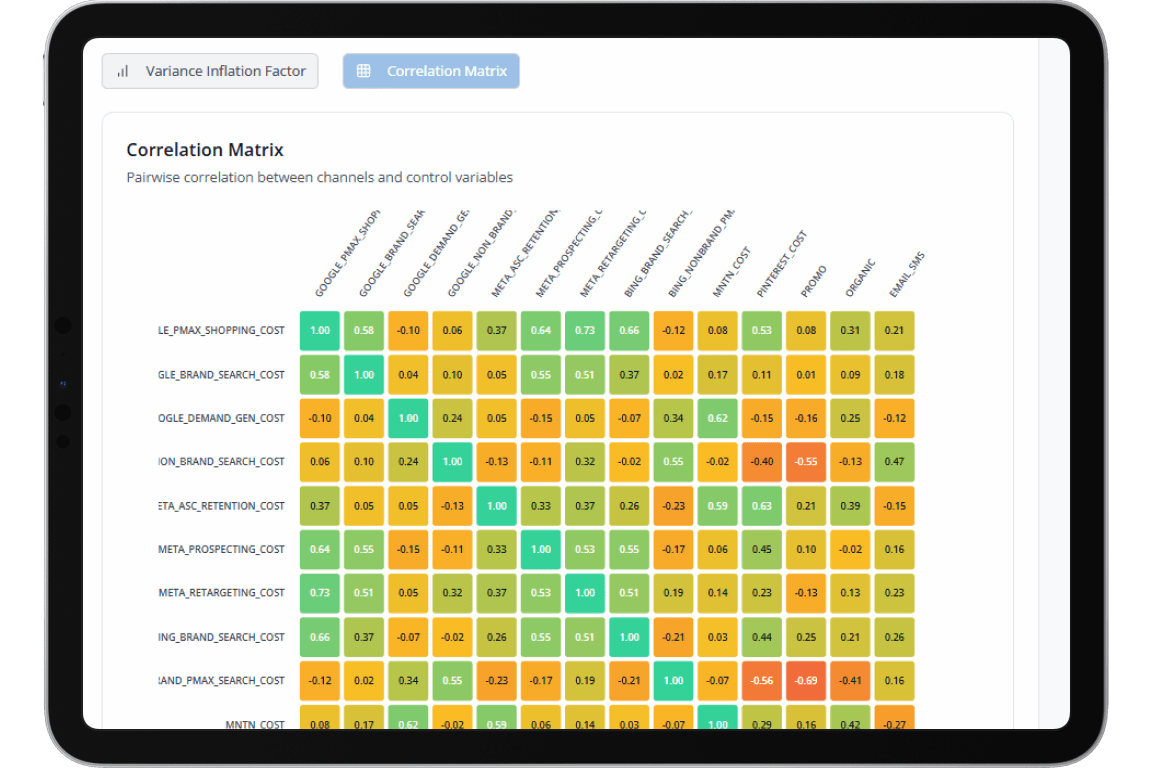
Correlation matrix table showing pairwise correlations between marketing channel costs and control variables with values color-coded from green to red.

MARKETING EFFICIENCY

Finding underperforming channels

Problem

Marketing teams continue spending on channels that may no longer deliver results because they lack reliable data. Budgets carry forward year over year without evidence that each channel still performs. Wasted spend accumulates.

Solution

With Domo MMM, channels with low or negative returns are identified automatically. The system highlights channels where additional spend delivers diminishing results and shows where budget could be reallocated. Teams make data-driven decisions to cut underperforming channels and reinvest in high-performing ones.

Budget Optimiser interface showing total budget of 300,000 for a quarter, with expected results including projected revenue of $11,554,350 and revenue lift of 95.2%.

CAMPAIGN PLANNING

Testing strategies before execution

Problem

Leadership asks questions like "what happens to revenue if we cut paid search by a third?" or "how much should we invest in brand versus performance marketing?" Teams can't answer these questions with confidence because they lack tools to test the impact of budget changes.

Solution

The Scenario Planner lets marketing leaders adjust channel budgets and see projected revenue impact. The system accounts for how effectiveness changes at different spend levels, providing data-driven answers to strategic questions. Teams plan quarterly budgets with evidence rather than spreadsheet assumptions.

Bar chart comparing current and optimized revenue results for various digital marketing channels, showing higher optimized values in most channels.

CHANNEL OPTIMIZATION

Making the most of current spend

Problem

Marketing teams know their overall budget but struggle to determine the optimal split between channels. Some channels are getting too much investment whilst others remain under-invested. Without understanding performance at different spend levels, teams can't optimize the mix.

Solution

Domo MMM analyses how each channel performs at different spend levels, showing where you get the best returns. The budget optimizer identifies channels with room to grow and channels that have hit limits. Marketing leaders reallocate spend to maximize total revenue within budget constraints.

Capacidades

Transforme sus operaciones empresariales.

Automatice para que pueda optimizar.

Reduzca las horas de trabajo manual propenso a errores y deje que los flujos de trabajo gestionen los pasos repetitivos de sus procesos para hacerlos más fiables, escalables y eficientes.

Line chart of out-of-sample revenue predictions with training data, actual test values, predicted mean, 95% confidence interval, and train/test split from 2023-01 to 2024-12.

Estos son algunos ejemplos de lo que puede automatizar con los flujos de trabajo:

A dollar bill

Ajusta tus precios en función de los activadores dinámicos.

A bar graph with an arrow going up

Actualice sus previsiones de ventas en función de las tendencias e inicie los cambios sin problemas al recibir la aprobación.

A checkmark inside a scalloped circle

Ahorre dinero verificando automáticamente a los usuarios de la cuenta y desactivando las cuentas inactivas en el sistema de origen.

An exclamation point inside a circle icon

Detecte automáticamente las anomalías en sus datos, cree un ticket de soporte y notifique a las partes interesadas.

Organice los pasos y las acciones.

Sus complejos procesos empresariales se basan en la coordinación de numerosas tareas, actividades y recursos. La organización de los procesos empresariales ayuda a aumentar la eficiencia, reducir los costos y mejorar el rendimiento general.

MMM Insights & Recommendations dashboard showing $50M incremental revenue, 0.86 model R², Google as top channel, 14.6% MAPE, and iROAS performance metrics for various marketing channels with status indicators.

Los flujos de trabajo le brindan las herramientas para:

A tree chart icon

Planifique los procesos empresariales, incluyendo quién y qué está involucrado.

A checkmark in a dashed box icon

Defina qué acciones deben tomarse en función de los datos en diferentes puntos del proceso.

A bar graph with a magnifying glass on it

Conecta las acciones de los usuarios para que todos puedan concentrarse en sus tareas.

A bell icon

Avise a las partes interesadas de dentro y fuera de su empresa sobre qué hacer y cuándo.

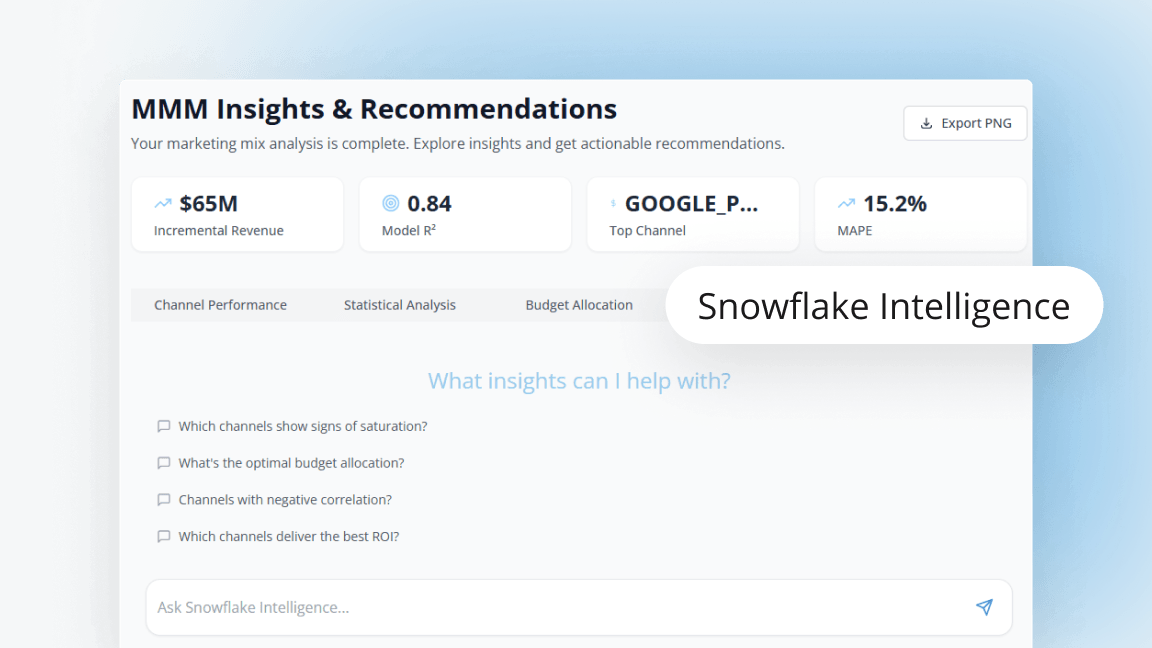
Dashboard showing MMM Insights & Recommendations with $65M incremental revenue, 0.84 model R squared, Google as top channel, and 15.2% MAPE, plus questions for Snowflake Intelligence assistant.

Estos son algunos ejemplos de lo que puede integrar con los flujos de trabajo:

‍

A data collection icon

Herramientas de análisis web

A line diverging into two arrow lines with a plus sign above it

Plataformas de datos

A computer icon

Sistemas de comercio electrónico

Gear icon

Plataformas CRM

A store icon

Sistemas de reserva de viajes

A cylinder in a house

Plataformas de marketing por correo electrónico

A bar graph with a magnifying glass on it

Sistemas de facturación

A dollar bill

Plataformas CRM

Integración con Domo

Libere toda la potencia de Domo con los flujos de trabajo

Domo ofrece una serie de herramientas que complementan y aumentan las capacidades que se encuentran en los flujos de trabajo.

Flow chart icon

Aprobaciones

Inicie un flujo de trabajo desde dentro de un

A bar graph under an up arrow

Alertas

Utilice

A USB icon

Funciones en la nube

Una biblioteca de funciones populares simplifica aún más la creación de flujos de trabajo.

Icon of a hand holding a phone

Aplicaciones empresariales

Integre los flujos de trabajo con los eventos y desencadenantes que se producen en el interior

Two database icons

Flujos de datos

Optimice y automatice sus flujos de datos.

A circle with a check mark in front of a circle with an "x"

Conjuntos de datos

Automatice la actualización o exportación de conjuntos de datos.

Recursos

Descubra las posibilidades de los flujos de trabajo consultando nuestras guías prácticas.

An X in a circle