Intro
You can manage DataSets and user accounts for connectors in the Data Center. Access the Data Center by selecting Data in the Domo navigation.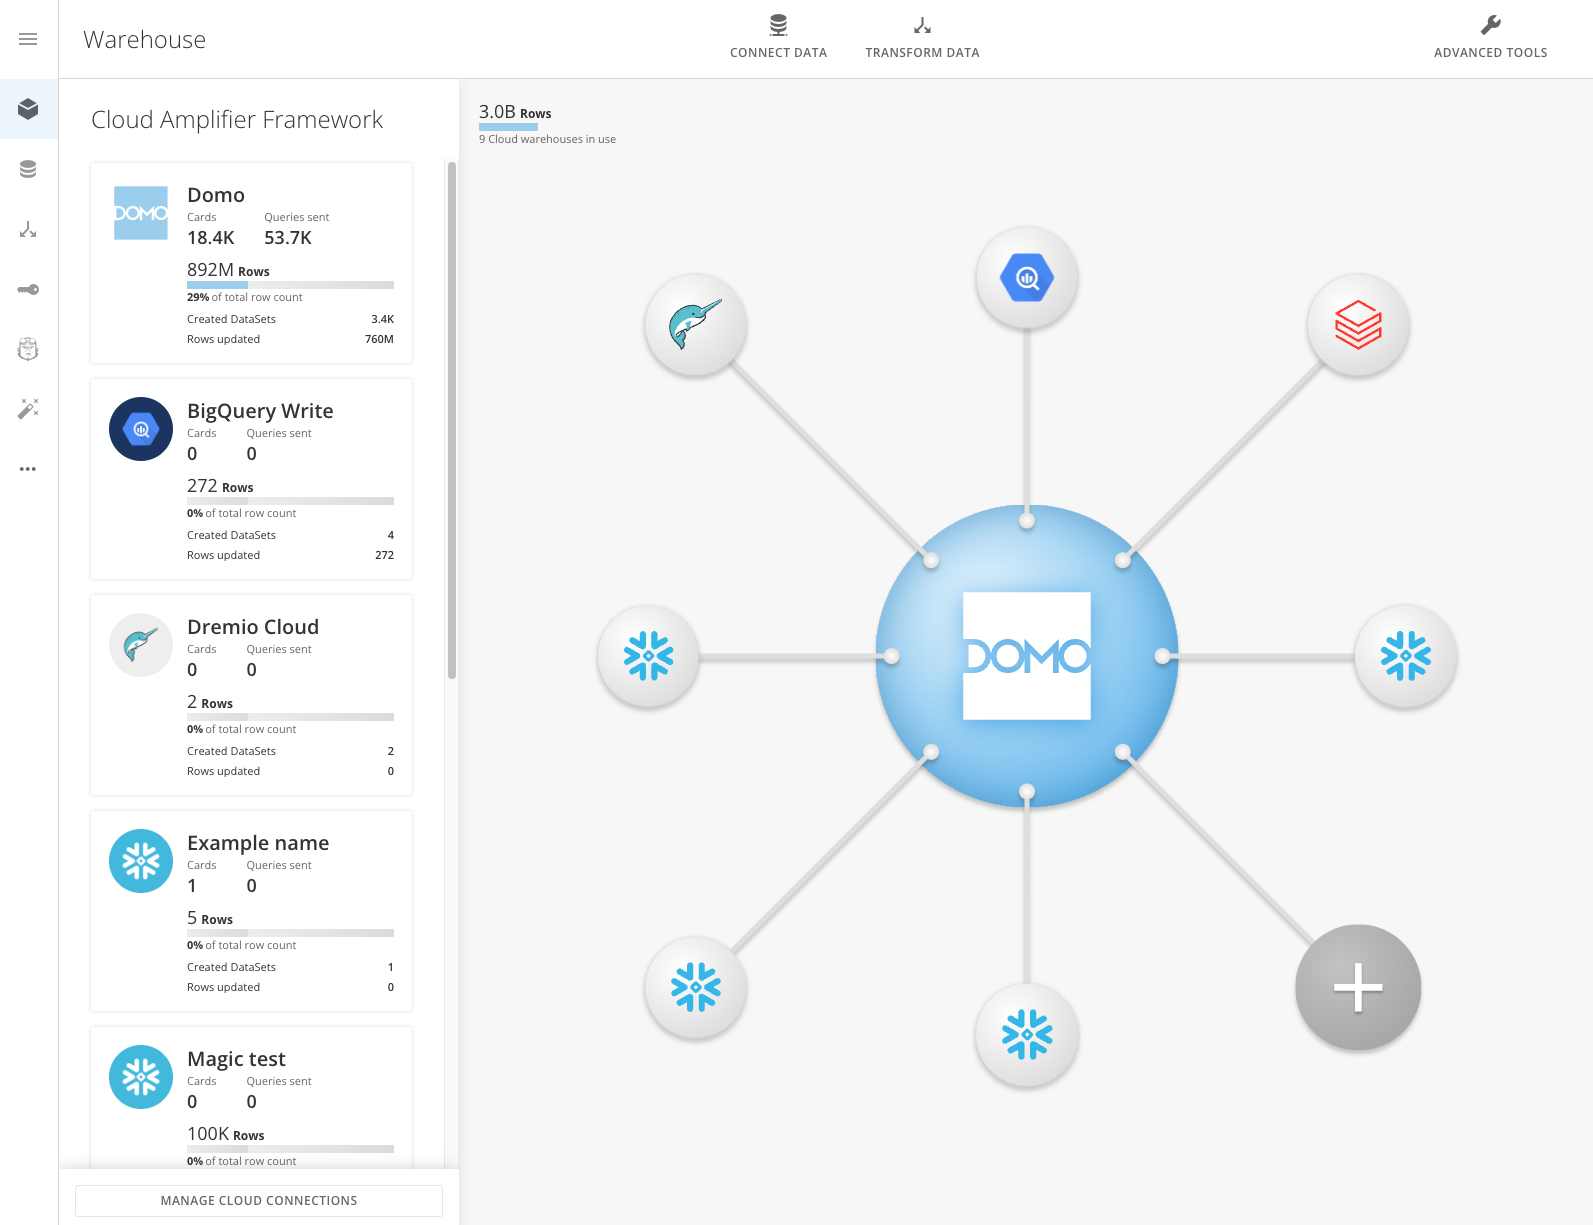
Tab | Icon | Description |
|---|---|---|
Data Warehouse |
| S ee a three-dimensional visual representation of all DataSets in your Domo broken down by connector. |
DataSets |
| View and manage DataSets added to Domo. For any DataSet, you can access a Details page that provides additional options. |
DataFlows |
| Create and manage DataFlows, DataSets created by combining and transforming two or more input DataSets. |
Accounts |
| Manage accounts used for connecting DataSets to Domo. |
Beast Mode Manager |
| View and manage Beast Modes created on your Cards. |
Data Science |
| View the Data Science Home Page to find the tools you need. |
More |
| View additional options that are enabled in your instance. |


 icon to show the names of the above tabs.
Data Warehouse
The Data Warehouse in Domo provides a three-dimensional visual representation of all DataSets in your Domo, broken down by connector, along with data currently flowing into and between them. DataSets for each connector type are represented as stacks on a rotating palette. You can configure the order and height of the connector stacks to indicate different metrics. For example, you could sort the connector stacks by number of rows but have the height of the individual stacks represent the number of DataSets. For more information about The Data Warehouse, see Using The Data Warehouse to Manage Data . In the Data Warehouse tab you have access to a toolbar that provides shortcuts for opening the DomoR installation page .DataSets and DataFlows tabs
The DataSets and DataFlows tabs list DataSets and DataFlows, respectively, in your Domo instance. In these tabs you can To access Jupyter, you need one of the following two grants enabled: Create Jupyter Workspace or Manage Jupyter Workspace. You can add these grants to a custom Domo role.- Create Jupyter Workspace — Allows a user to create, edit, and delete Jupyter Workspaces to which they have access.
- Manage Jupyter Workspace (Jupyter Admin) — Allows a user to view, edit, and delete any Jupyter Workspaces in the instance. This grant is needed to enable workspace sharing for other users.
- Create Fileshare Directories — Allows a user to create, edit, and delete File Share directories to which they have access.
- Manage Fileshare Directories — Allows you to view, edit, and delete any File Share directory in this instance.
Enable Jupyter
To start using Jupyter, a Jupyter Admin must enable the feature for your instance. Admins can follow the steps below:- In the navigation header, go to More > Admin.
- In the Features menu, select Jupyter.
- Activate the feature by adjusting the toggle next to Jupyter Account Inactive.
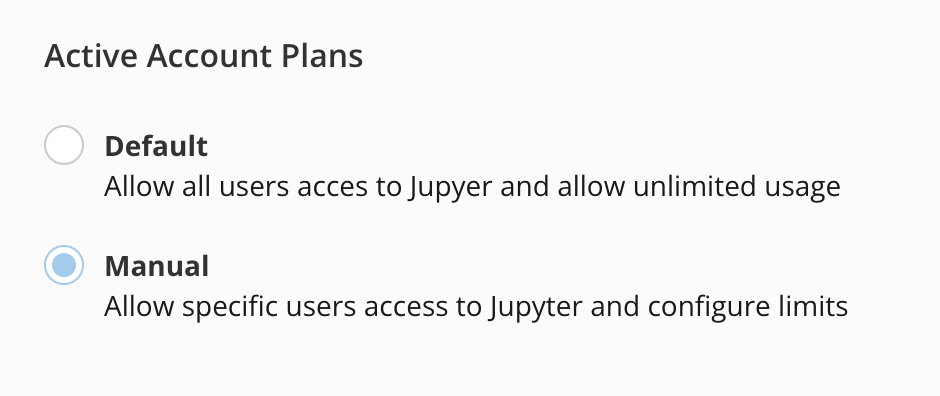
- After activating the account, choose the account plan you want:
- The Default account plan allows all users access to Jupyter and gives all users unlimited usage.
- The Manual account plan allows specific users access to Jupyter and gives you the option to configure usage limits.
- Select a Compute Tier Limit. To learn more about tier limits, contact your Domo account team.
- Select Save.
Access Jupyter Workspaces
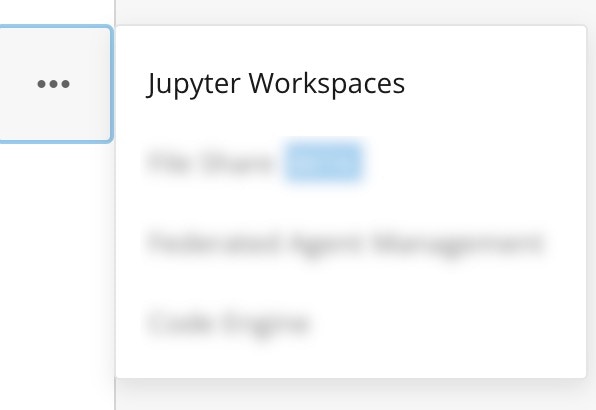
In the navigation header, select Data. The Data Center displays. In the left navigation, select More > Jupyter Workspaces.
Jupyter Workspaces Tasks
The next sections describe certain tasks within Jupyter Workspaces, including creating a workspace, enabling workspace sharing, sharing a workspace, viewing instances in a shared workspace, running a workspace, editing a workspace, and deleting a workspace.Create a Workspace
To create a workspace, Jupyter must be enabled for your instance. See the headings for Required Grants and Enable Jupyter for instructions.- In the navigation header, select Data.
-
In the left side rail, select
 More > Jupyter Workspaces.
- Select + New Workspace . The Create Jupyter Workspace modal displays.
- Customize the workspace by configuring the following:
- In the Name and Description fields, enter a workspace name and optional description.
- Enter values in the Kernel, Compute Tier Limit, and Timeout fields.
- (Optional) Select Input DataSets
- (Optional) Select Output DataSets
- (Optional) Add an Account. In this step, you can add a third-party account, such as your Google account, to reference in your workspace.
-
(Optional) Add a File Share. See
Create a File Share for instructions.
Note: If you share your workspace with other users, they can see third-party accounts referenced in the workspace. However, they cannot read any account keys or values. To share an account with a user, navigate to Data > Accounts. Input and Output DataSets are also shared with Co-Owners.
Option | Description |
|---|---|
Name | The name of the Jupyter workspace The following characters are not supported in the name: ” |
Description | Optional description to provide more details about the workspace |
Computer Tier Limit | The computer size that is allocated to the workspace and any data flows that are associated with this workspace |
Timeout | The amount of time with no user activity in the Jupyter UI before the workspace automatically stops. |
Kernel | Python or R Kernels are available |
Start workspace on successful creation | Once created, the process to start the workspace will be performed |
Input DataSets | Optional Domo data sources that are available to use in the Jupyter workspace |
Output DataSets | Optional DataSets that are available to write data as part of the Jupyter processing |
Account | Optional third-party account(s) to reference in your workspace |
File Share | Optional avenue to share files within your workspace. To learn more, see the headings for Create a File Share and Use a File Share . |
- Select Save.
Enable Workspace Sharing
In order for a workspace to be shared, an Admin or user with the Manage Jupyter Workspace grant must enable sharing.- From the Jupyter Workspaces list, navigate to the workspace you wish to share.
-
Hover to the right of the workspace. The
 Manage Workspace menu displays.
-
Select the
 Manage Workspace menu and choose Enable Sharing.
- Select Continue and Confirm. By selecting Confirm, you are acknowledging the risks associated with sharing notebooks and workspaces.
Share a Workspace
In order for a workspace to be shared, an Admin or user with the Manage Jupyter Workspace grant must enable sharing. See Enable Workspace Sharing.- From the Jupyter Workspaces list, navigate to the workspace you wish to share.
-
Hover to the right of the workspace. The
 Manage Workspace menu displays.
-
Select the
 Manage Workspace menu and choose Share this Workspace.
- Enter the recipient’s name, select the appropriate permissions, and select Add.
- Select Save.
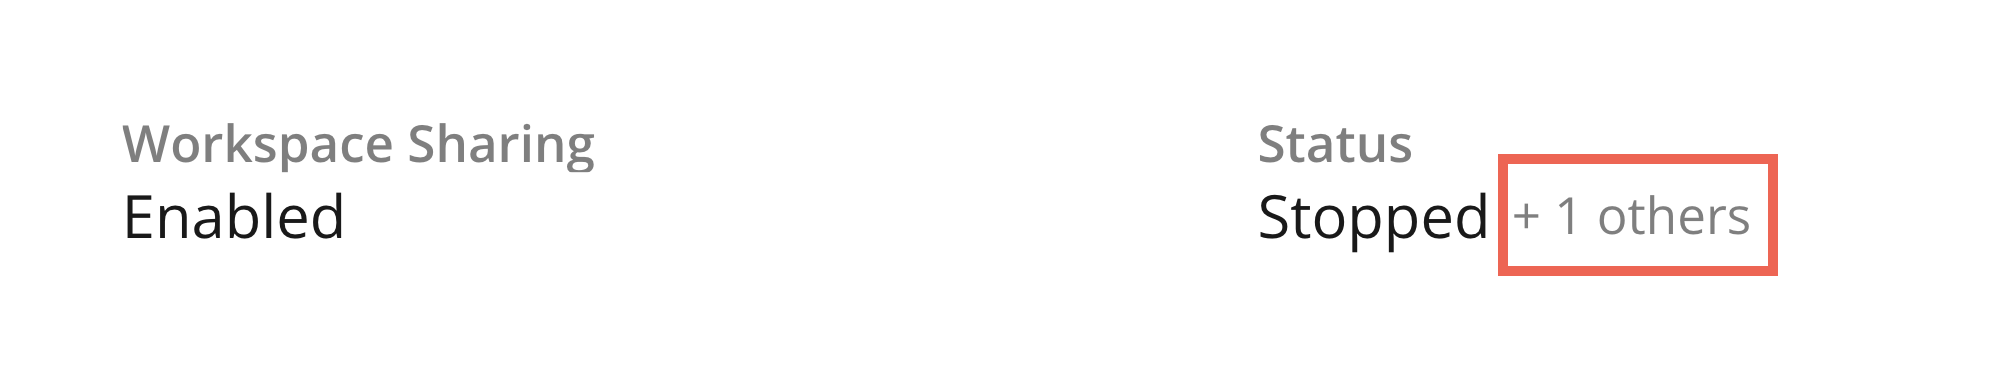
View Instances in a Shared Workspace
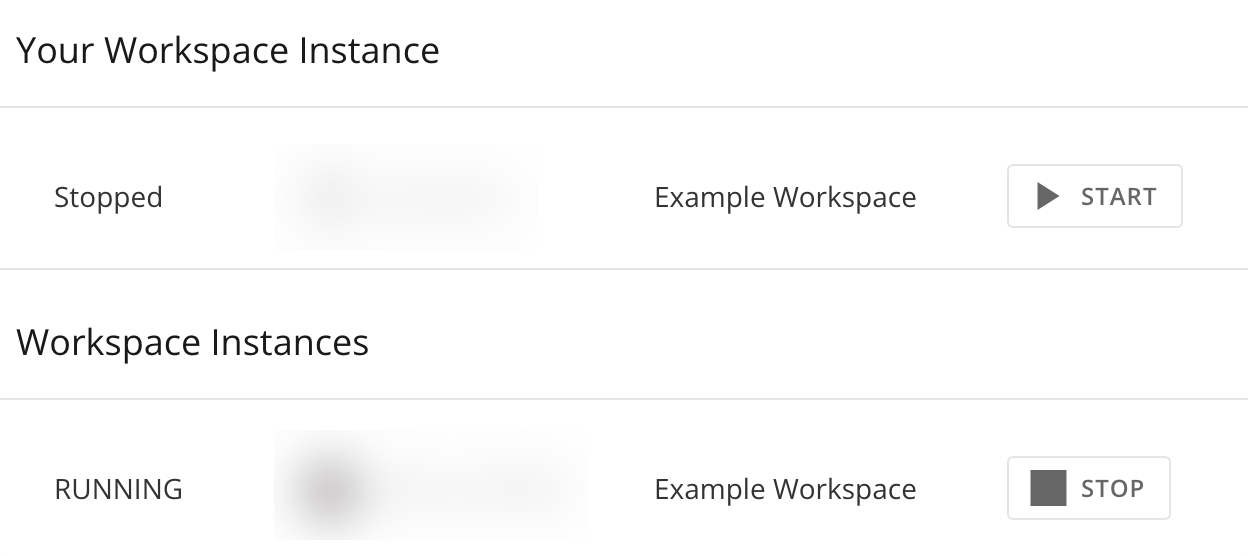
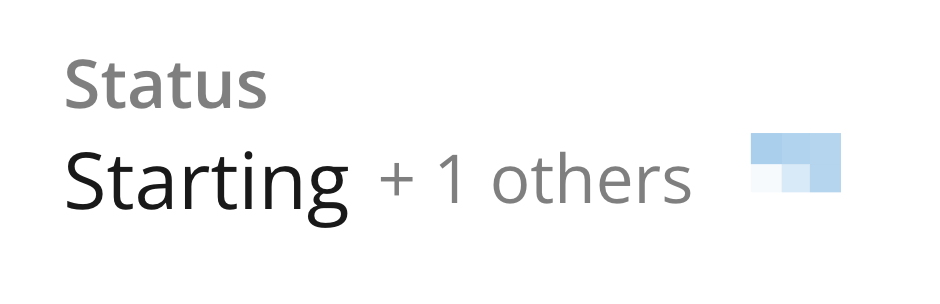
When a workspace is shared, other users can add an instance to the workspace. In the image below, the workspace has sharing enabled and has been shared with one other user.
Run a Workspace
- From the Jupyter Workspaces list, select the workspace you want to run.
- Select Start.

- After the workspace is done loading, select the workspace title.
Edit a Workspace
- From the Jupyter Workspaces list, locate the workspace you wish to edit.
-
Hover to the right of the workspace. The
 Manage Workspace menu displays.
-
Select the
 Manage Workspace menu and choose Edit.
- Add new specifications to the workspace and select Save.
Delete a Workspace
- From the Jupyter Workspaces list, navigate to the workspace you wish to delete.
-
Hover to the right of the workspace. The
 Manage Workspace menu displays.
-
Select
 Manage Workspace menu and choose Delete.
- Confirm that you wish to delete the workspace by selecting the Delete button.
File Sharing
You can create and add a File Share to your Jupyter Workspace. The following headings describe how to create a File Share, add it to your workspace, and delete a File Share from your workspace.Create a File Share
Follow these steps to create a File Share to use in Jupyter Workspaces. See the heading for Use a File Share to learn how to connect a File Share with Jupyter Workspaces.- In the Domo navigation header, select Data.
-
In the left side rail, select
 More > File Share.
-
Select
+ New File Share.
The Create a File Share modal displays.

-
Customize the File Share by configuring the following:
- In the Name and Description fields, enter a File Share name and optional description.
- In the Default Mount Point field, enter a path. This can be whatever you would like.
- Select Save to create the new File Share.
Use a File Share
- In the File Share section of the modal, select Add File Share.
- In the search field, search for and locate the File Share you want to add to the workspace.
- Select the File Share.
-
The File Share displays in the modal. By default, the Mount Point is the default Mount Point, and the checkbox for
Use default is checked. To use a different Mount Point, uncheck the Use default checkbox and expand the list to select the Mount Point you want to use.

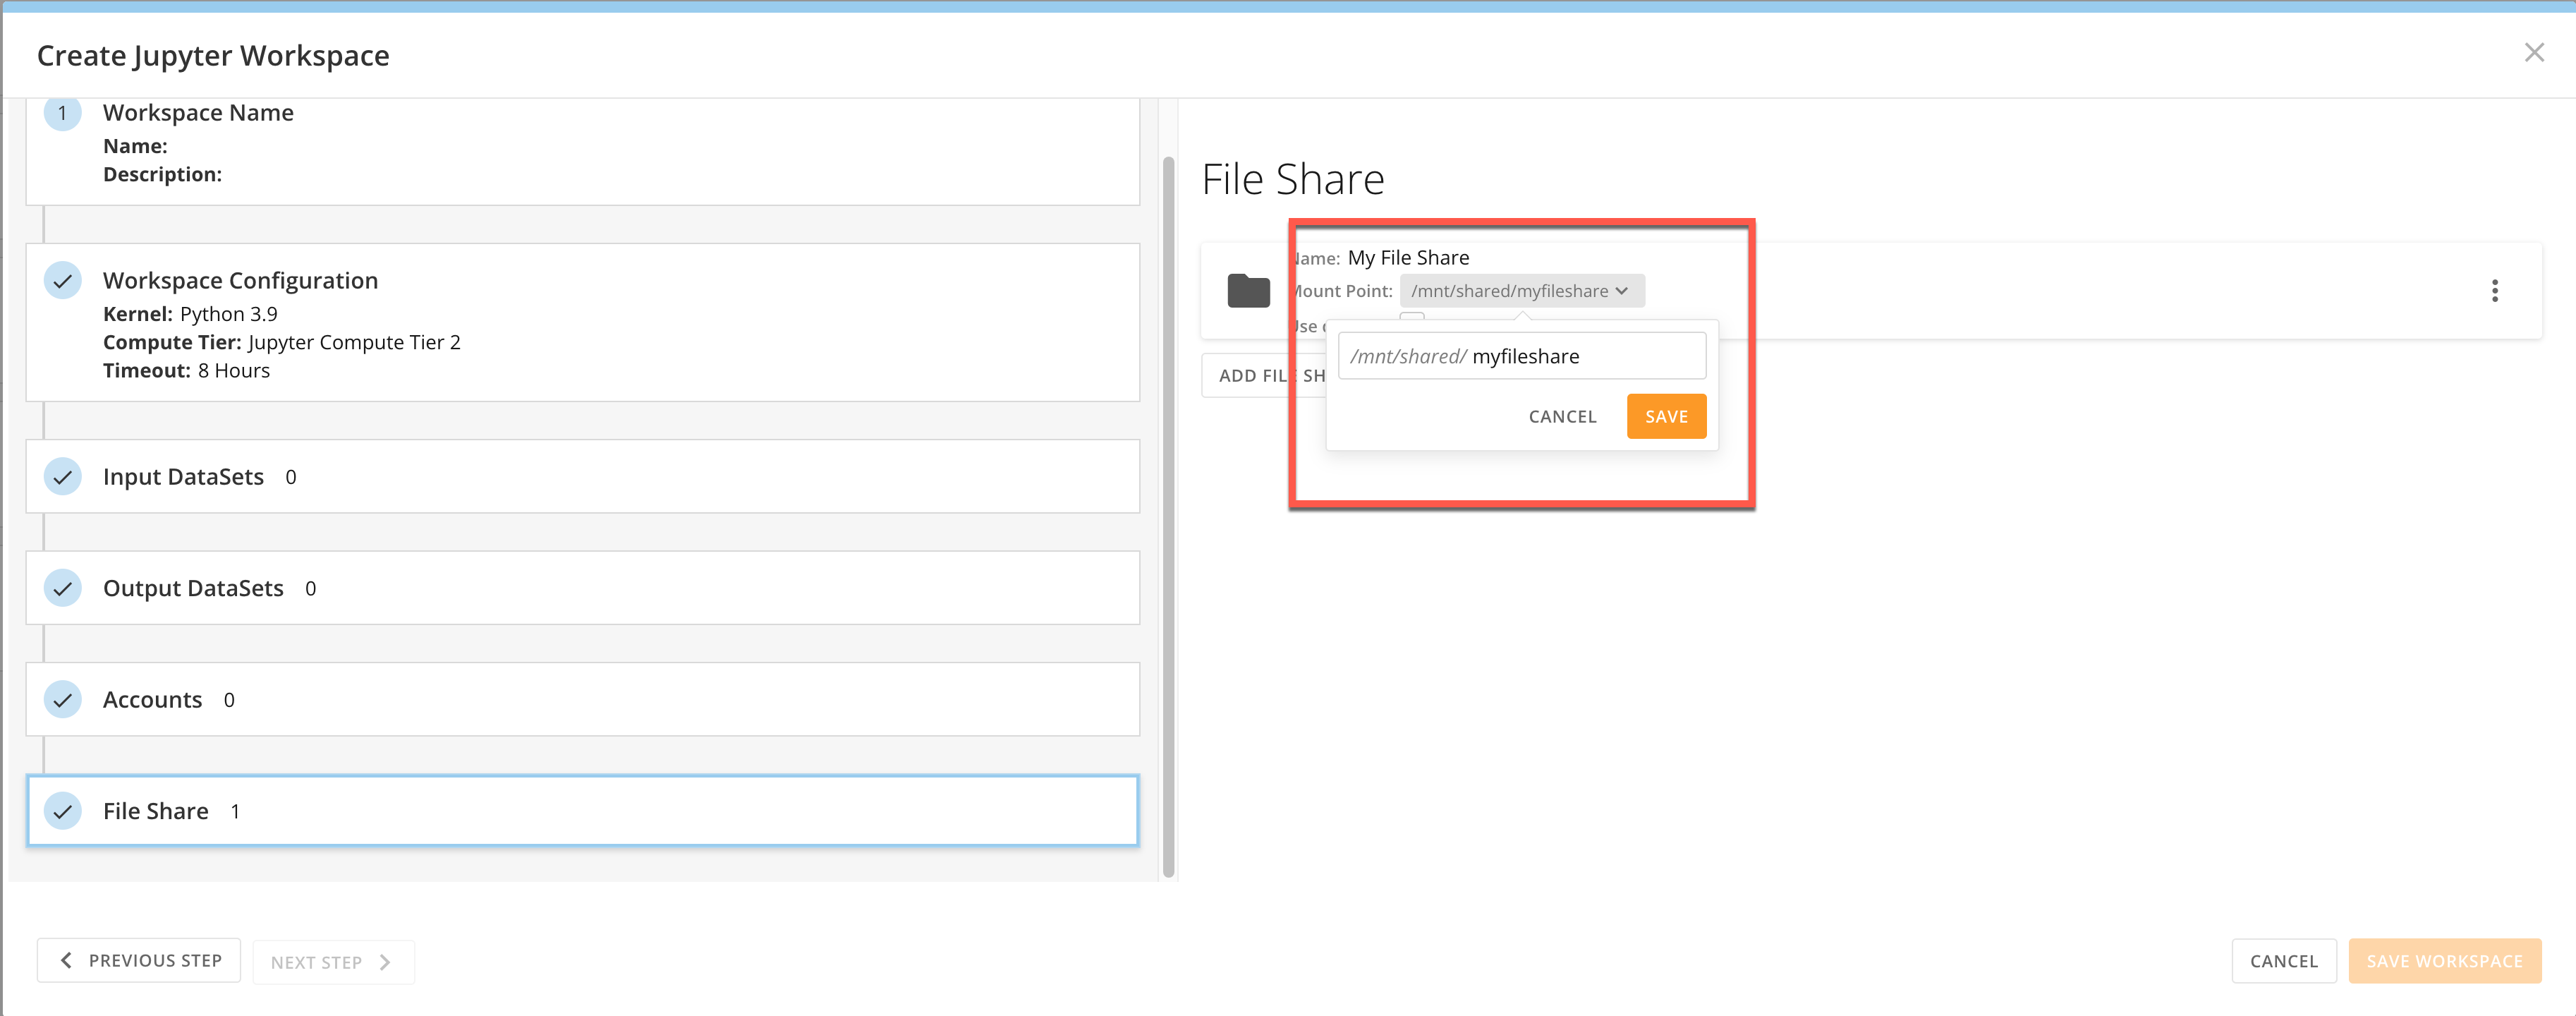
- Select Save Workspace.
Delete a File Share
- Access the Create Jupyter Workspace or Edit Jupyter Workspace modal. To learn how to access these modals, see the headings for Create a Workspace and Edit a Workspace.
-
In the
File Share section of the modal, identify the File Share you want to delete and select the
 kebab menu.
-
Select
Delete.

Jupyter Notebooks
A Jupyter notebook is a file that consists of one or more cells. In these cells, you can write and format text, as well as write code using Python or R programming languages. When you execute the contents of a cell, the resulting output associated with the text or code displays directly in the notebook. The output can take various forms such as text, figures, tables, and images. You can add, edit, move, duplicate, re-run, and delete cells within a notebook at your discretion. You can also run cells sequentially to perform different phases of your project one after the other. For example, the first cell in your notebook could contain code to read in your DataSet; the second cell could then contain code that specifies what analysis to run on the DataSet. See Cells to learn about the types of cells, how to add them to a notebook, and how to execute them. Because a Jupyter notebook file can display executable code and the associated code output, along with explanatory text and images, a notebook can serve as a complete record of your interactive session. You can save a Jupyter notebook to your Jupyter workspace, enabling you to access your notebook and its contents in the future. Jupyter notebooks are internally JSON files and are saved with the.ipynb extension. You can also download a notebook from your workspace and save it elsewhere or share it.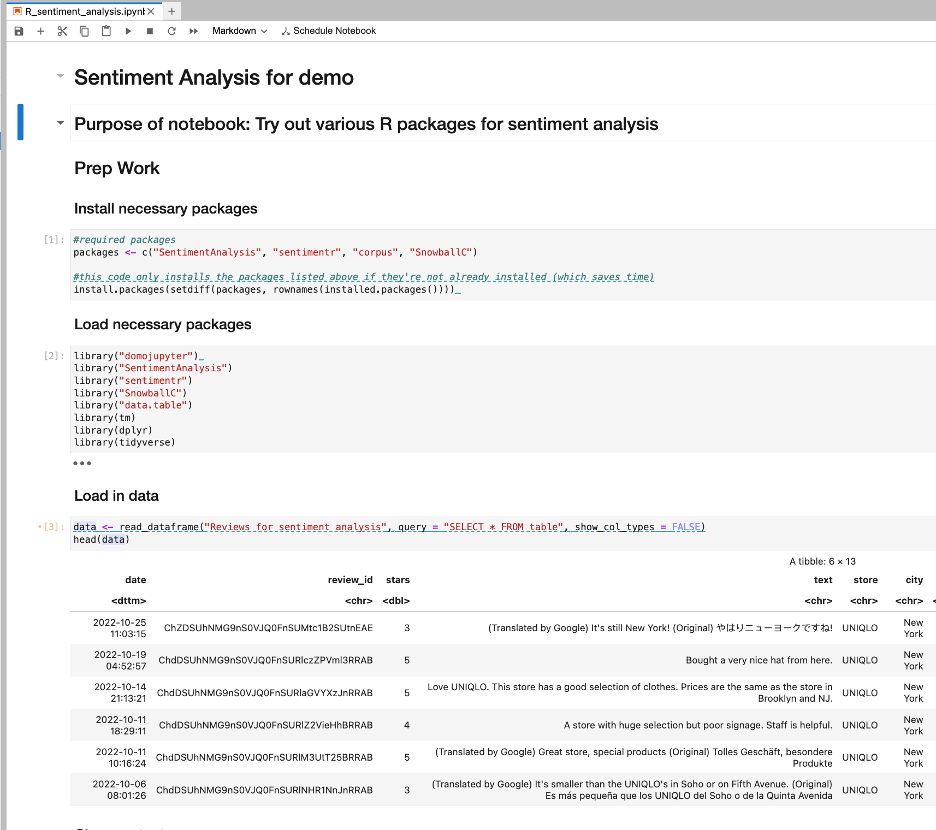
Edit Jupyter Notebooks
Create a Notebook
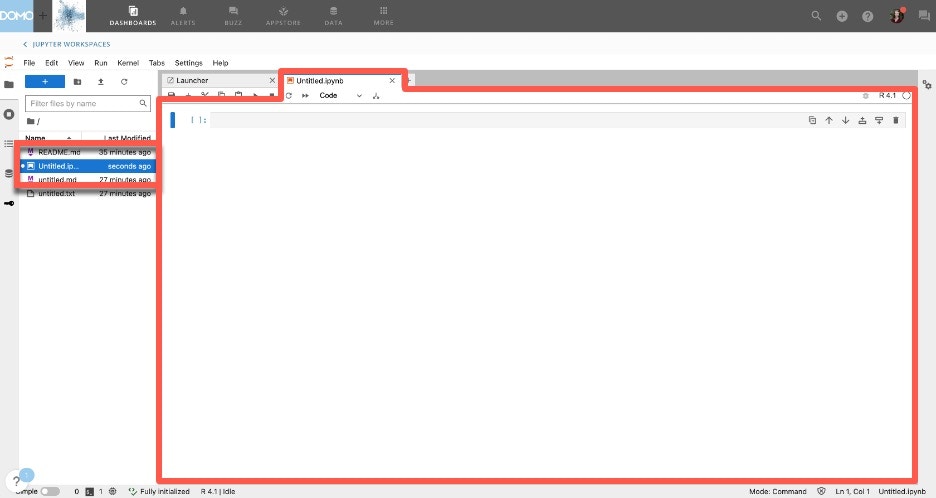
Follow these steps to create a notebook:-
In the Jupyter workspace, select
File > New > Notebook.
The Select Kernel modal displays.

-
Press
Select.
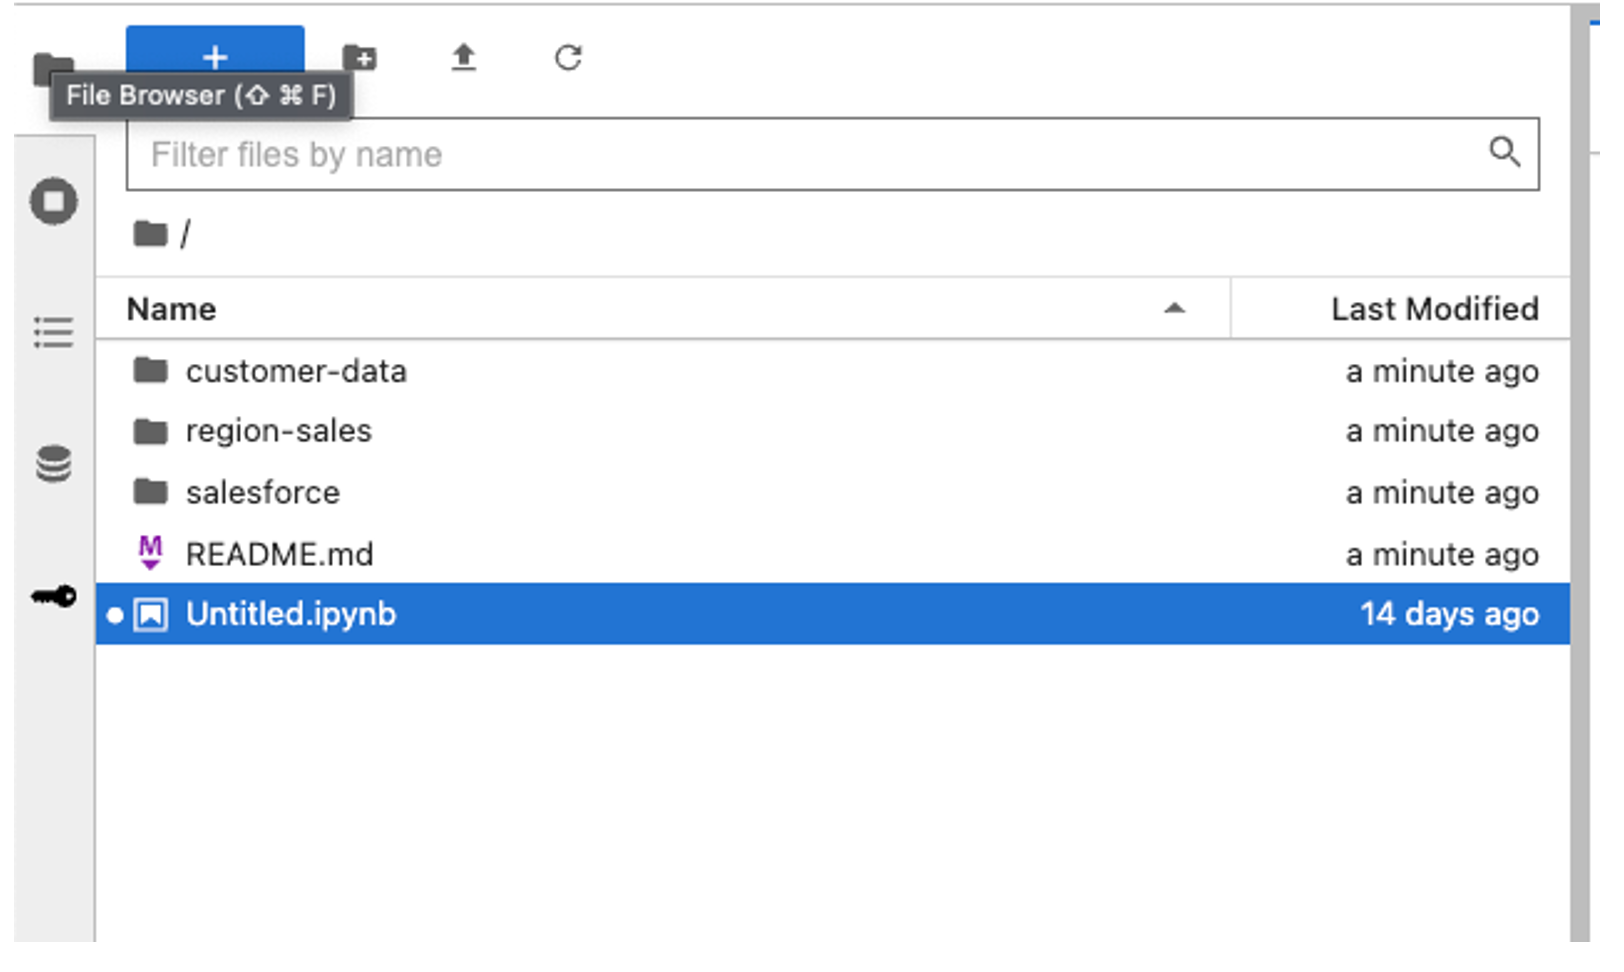
A notebook named Untitled.ipynb opens in the main work area. The untitled notebook also displays in the File Browser in the workspace side panel.
Rename a Notebook
You can rename a notebook either from the main work area or from the File Browser, depending on whether the notebook is open or closed. Select the appropriate option below:-
Notebook open —
In the main work area, right-click the title of the notebook to display the notebook options and select Rename Notebook. The Rename File dialog displays. Enter a new name for the notebook and select Rename.

- Notebook closed — In the File Browser, right-click the title of the notebook that you want to rename to display the file options, then select Rename. Enter a new name for the notebook. For a DataSet, you can view information about the DataSet, including the connector, the name, the owner, the number of rows and columns in the DataSet, the number of cards being powered by the DataSet, the total number of times these cards have been viewed, and the amount of time since the DataSet was last updated. You can also preview or delete a DataSet. For a DataFlow, you can view information about the DataFlow, including the name, owner, number of input and output DataSets, number of runs vs. success rate, and the amount of time since the DataFlow was last run. Both tabs include options for searching with or without filters, applying quick filters, saving favorite filters, and sorting the DataSets/DataFlows in the list.
-
add DataSets and DataFlows
From either tab you can…
- add data into Domo from third-party systems , then transform the data to power up multiple cards without having to locate and re-upload that DataSet for each card.
- add Magic transforms of any kind— DataFusions .
- get information about and download Workbench .
- get information about installing the DomoR plugin .
- visually identify DataSets needing attention DataSets with errors do not run as scheduled until errors are resolved. Domo lets you know when a DataSet cannot run successfully by displaying the error on the DataSet in the Data Center and in the Accounts page, and by sending the owner of the DataSet an alert that describes the error and links to the DataSet.
Name | Description |
|---|---|
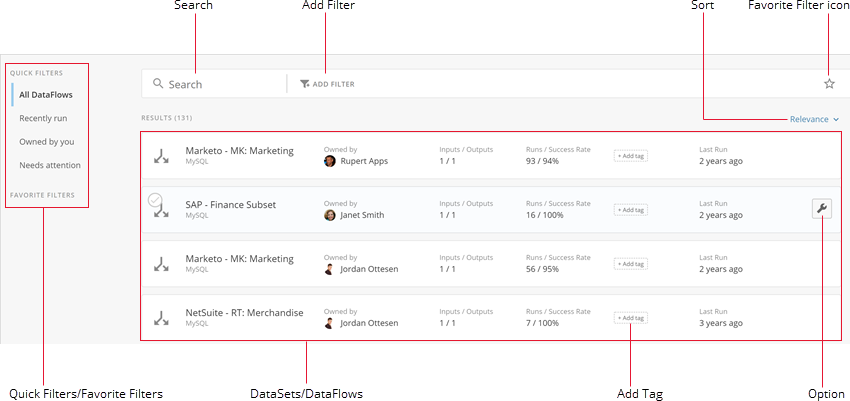
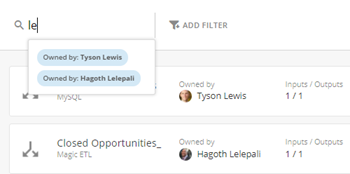
Search | Lets you search for the desired DataSet/DataFlow in the list. This search draws from a variety of metadata, including name, connector, owner, tags, status, and more. You can refine your search by doing any of the following:
|
| Add Filter | Lets you filter the DataSets or DataFlows in the list. This option is described in more detail in the entry for “Search,” above. |
| Favorite Filter icon | Lets you save the current filter configuration. When you click this icon, you are prompted to enter a unique name for the filter. When you save the new filter, the star icon turns gray and the filter appears under Favorite Filters in the panel on the left side of the screen. You can then click this filter anytime to apply it. You can remove a saved filter by clicking the gray star icon and then choosing Remove . You can also do a “Save As” on a saved filter. This is useful when you make changes to an existing filter and want to keep both filters. To do this, you click on the gray star icon, enter the new filter name in the name field, click Update , then select Save As New Filter . These options are also available via the Favorite Filters area in the panel on the left side of the screen. If you mouse over a filter here, a gear icon displays. Clicking this icon reveals the following options:
|
Sort | Lets you sort the DataSets or DataFlows in the list. This option is described in more detail in the entry for “Search,” above. |
| Quick Filters/Favorite Filters | Lets you quickly apply any prebuilt filters ( Quick Filters ) or saved filters ( Favorite Filters ). Available Quick Filters include the following:
Favorite Filters are those filter configurations you have saved. These are described in more detail in the entry for “Favorite Filter icon,” above. |
DataSets/DataFlows | Display information about each DataSet or DataFlow. For DataSets, this information includes the name, connector, owner profile picture, number of rows and columns, number of cards powered by the DataSet, any tags, and the last update time. For DataFlows, the information includes the name, owner, number of input and output DataSets, number of runs versus the success rate, any tags, and the last run time. For each DataSet or DataFlow, you can do the following:
For a DataFlow, you can also mouse over the “Inputs/Outputs” data to show all of the input and output DataSets for this DataFlow. |
| Add Tag | Lets you add search tags to this DataSet or DataFlow so you can easily find it later by searching for those tags. When you click Add tag , a dialog appears with a list of existing tags. (If no tags have yet been added for your company, this list appears blank.) You can then do either of the following:
You can remove a tag from a DataSet or DataFlow by clicking the “x” next to the tag while in this dialog. You can also access the tagging functionality by doing any of the following:
You can add tags to multiple DataSets or DataFlows at once by selecting the DataSets or DataFlows (by checking their checkboxes), clicking While in the list view for a DataSet or DataFlow, if you click a tag, the list filters to show only DataSets and DataFlows with that tag. |
Options icon
| Displays a menu of options for the DataSet or DataFlow. Appears when you mouse over the row for a DataSet or DataFlow. For a DataSet, available options are as follows:
For a DataFlow, available options are as follows:
|
 that provides access to various options for interacting with this DataSet or DataFlow. These options are listed in the entry for “Options,” beow.
  icon on the right side of the blue bar. For more information about tagging, see the entry for “Add Tag” in this table.
  icon on the right side of the blue bar then selecting the desired option:
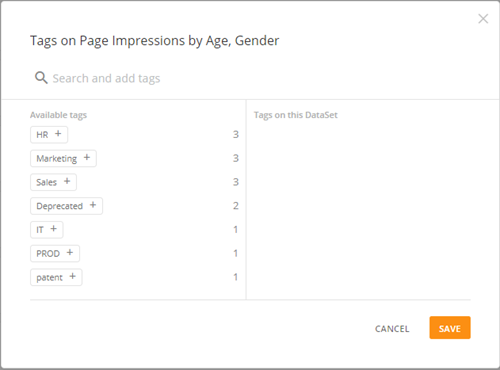
 to open the tagging dialog, then adding tags as desired. For more information about this dialog, see the entry for “Add Tag” in this table.
View Details
When you click the name of a DataSet or click > View Details , a page appears showing details for the DataSet. This page is divided into a number of tabs. Some of these tabs appear for every DataSet you view, while others only appear for specific user roles and connector types. These tabs are Overview, C ards , History , Settings , Data Lineage , and Personalized Data Permissions .
For more information, see Adding a DataSet Using a Connector .
Video - Domo Interface - DataSet Details
> View Details , a page appears showing details for the DataSet. This page is divided into a number of tabs. Some of these tabs appear for every DataSet you view, while others only appear for specific user roles and connector types. These tabs are Overview, C ards , History , Settings , Data Lineage , and Personalized Data Permissions .
For more information, see Adding a DataSet Using a Connector .
Video - Domo Interface - DataSet Details
- The Overview tab includes four tiles that show you the number of cards powered from this DataSet, the number of users it is being shared with, the number of DataSets built from the connector, and the number of DataFlows created from the DataSet. All of these tiles also provide “jump-off points” to other actions in Domo using this DataSet.
- The Cards tab contains previews of cards powered by the DataSet.
- The History tab shows the run history for the DataSet and only appears if the DataSet has run history data.
- The Settings tab lets you change the connector configuration options for the DataSet. It only appears if you are the DataSet owner or have an “Admin” security role or a custom role with the “Manage DataSets” privilege enabled.
- The Data Lineage tab shows you the lineage for this DataSet.
- The Personalized Data Permissions tab allows you to set PDP policies on the DataSet and does not appear unless you are the DataSet owner or have an “Admin” security role or a custom role with the “Manage DataSets” privilege enabled.
General options
The following screenshot shows the details view for a sample DataSet called “College Enrollment.” All of the options called out here are available in all tabs.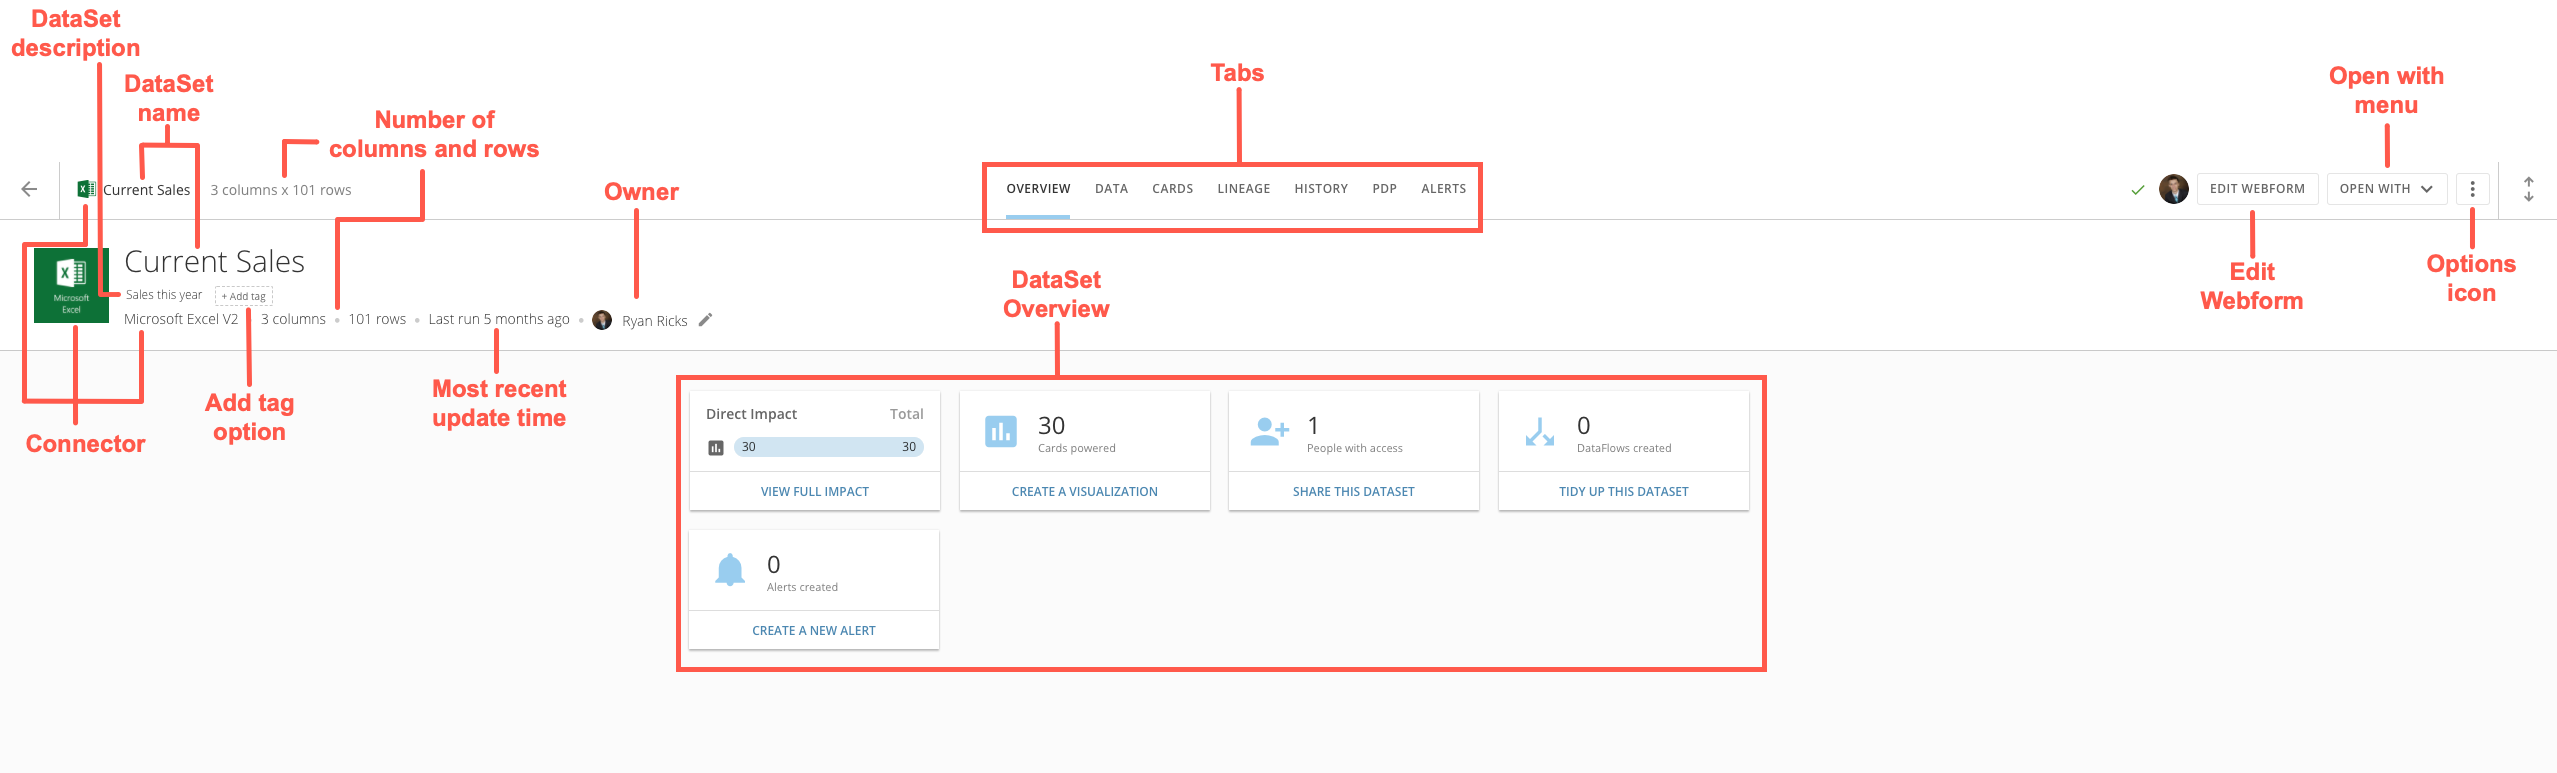
Name | Description |
|---|---|
Connector | The connector for this DataSet. For more information about connectors, see Configuring Each Connector . |
DataSet description | A description of this DataSet. You can add or change a description by selecting Edit Name & Description in the Options menu then entering the desired description. |
DataSet name | The name of this DataSet. You can add or change a name for a DataSet by selecting Edit Name & Description in the Options menu then entering the desired name. |
Number of columns and rows | A size indicator for the DataSet. |
| Add tag option | Lets you add search tags to this DataSet. If any tags have already been added, they appear here. Adding tags is described in more detail in the previous table. |
Most recent update time | Indicates when this DataSet was last refreshed. For more information, see Setting the Expected Update Frequency for a DataSet . |
Owner | Shows who owns this DataSet. You can click a user’s photo to see an avatar card with his or her basic information and a Go To Profile button that provides access to the Profile page. For more information about the Profile page, see Profile Page Layout . |
DataSet Overview | Shows how this DataSet is being used. |
Tabs | Let you switch between the tabs in the details page for the DataSet. Information about each tab is provided later in this section. |
Edit Webform | Edit Webform (Webforms only). Lets you edit the data for this Webform. For more information, see Uploading a webform . |
Open with menu | Provides access to a number of options for the DataSet. Some options may not appear, depending on the Connector and your security role.
|
Options icon | Provides access to a number of options for the DataSet. Some options may not appear, depending on the Connector and your security role.
|
Overview tab
In the Overview tab you can see how the DataSet is being used, the number of Cards powered from this DataSet, the number of users it is being shared with, the number of DataFlows created from the DataSet, and the number of Alerts on the DataSet. All of these tiles also provide “jump-off points” to other actions in Domo using this DataSet. The following screenshot shows an example of these tiles in the Overview tab for a typical DataSet.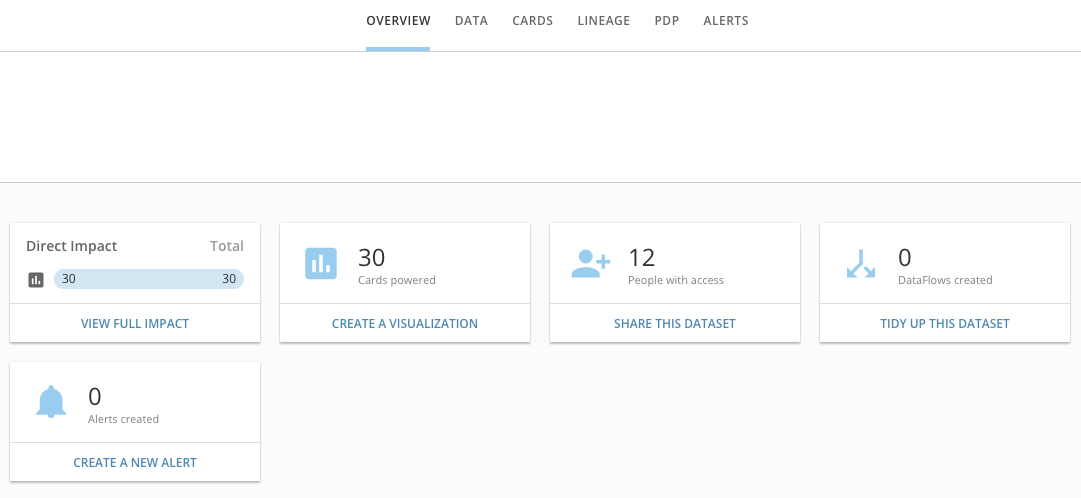
- View Full Impact opens the Lineage tab for the DataSet.
- Create A Visualization opens the Analyzer for this DataSet so you can build a chart or table from it. For more information about Analyzer, see Analyzer Overview .
- Share This DataSet opens the menu to share the DataSet with users.
- Tidy Up This DataSet opens the interface for building an ETL DataFlow using this DataSet.
- Create A New Alert opens the interface for creating an Alert on the DataSet.
Data tab
In the Data tab, you can do all of the following:- View all of the rows in the DataSet, and sort and filter to show the data interests you.
- See statistics for individual columns or for the entire DataSet.
- Change the order of columns in the DataSet.
- Rename columns in the DataSet.
- Add or edit column descriptions.
- Add search tags for columns.
 or restore it to its original size by clicking
  . You can Show column statistics/Hide column statistics by clicking
  . This allows you to show or hide the “filter charts” that appear at the top of the column pane in the Table subtab. Appears in the Table subtab only.
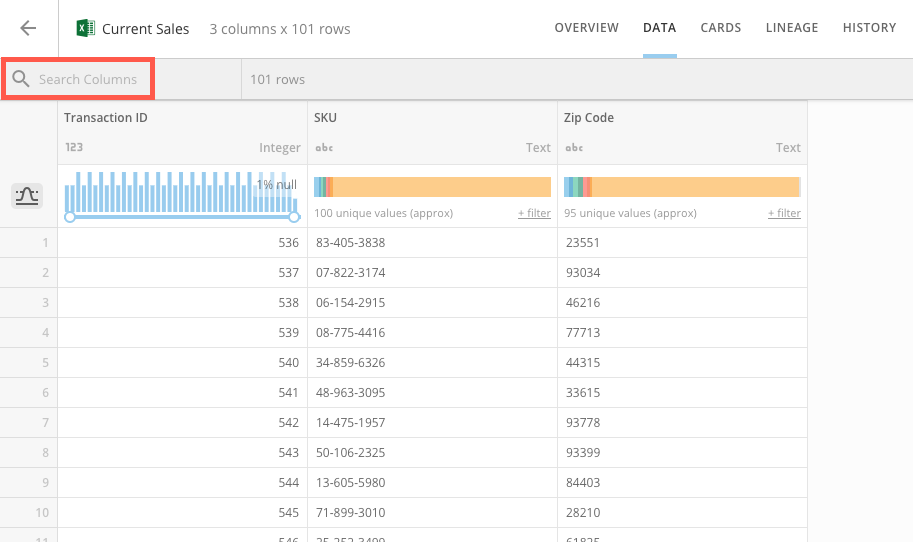
Table subtab
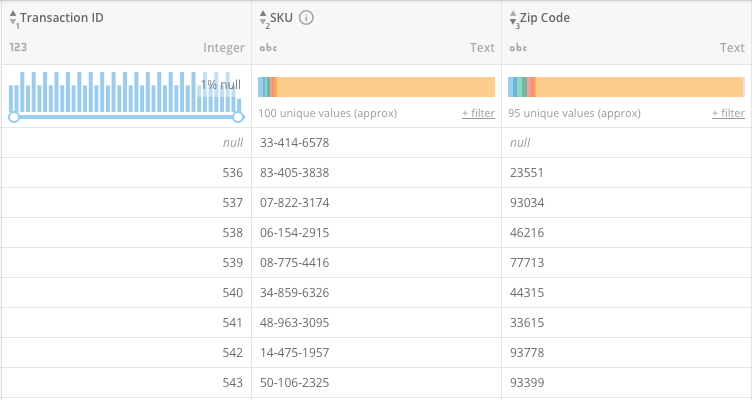
In the Table subtab, you can see all of the columns in your DataSet. Options are available for searching, sorting, and filtering so you can find the data you need. The following screenshot shows the components of the Table subtab: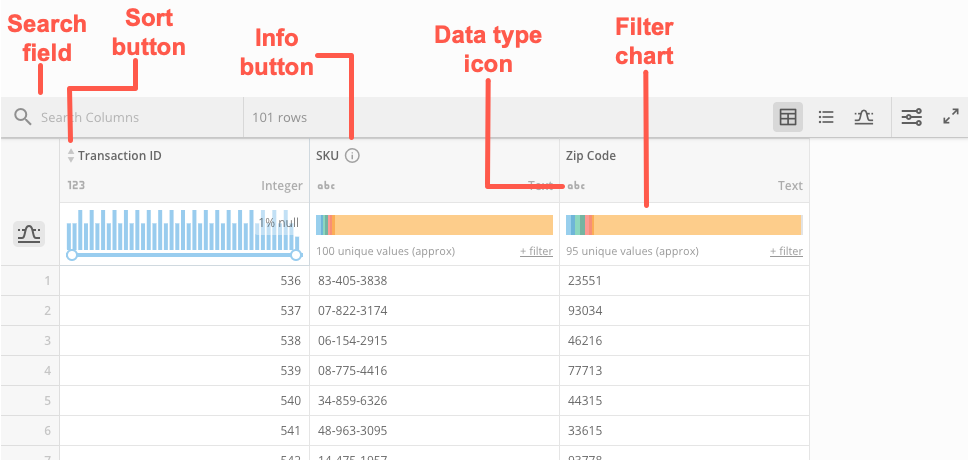
| Name | Description |
|---|---|
Sort button
| Lets you sort the values in a given field in ascending or descending alphanumerical order. Sorts are “nested” based on the order in which you apply them. The numeral beneath the sort icon tells you the priority of this column in your sort. For example, if a user first applied an ascending sort to the “Transaction ID” column, all of the rows in the DataSet would be ordered in numerical order. If he then applied an ascending sort to the “SKU” column, the groupings of rows for each SKU would be ordered numerically. If he finally applied a third sort, descending, to the “Zip Code” column, those values would be sorted in descending order for each transaction-SKU grouping. The following screenshot shows an example of this behavior: |
Info button
| Shows the description for this column, if you have added one in the Schema subtab. |
| Data type icon | Indicates the data type for this column.  indicates a numeric (value) column, indicates a numeric (value) column,  indicates a date or date-time column, and indicates a date or date-time column, and  indicates a string column. For more information about data types, see Understanding Chart Data . indicates a string column. For more information about data types, see Understanding Chart Data . |
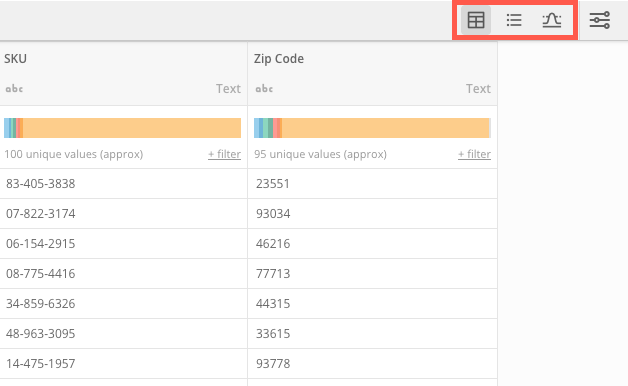
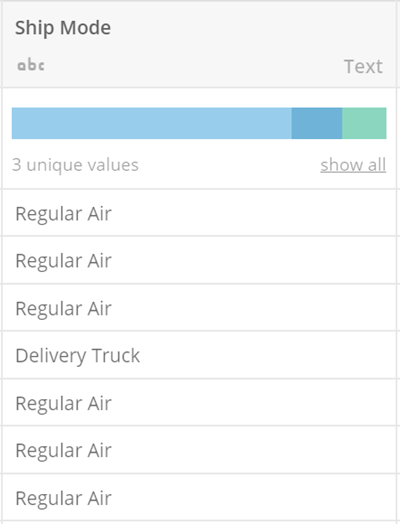
| Filter chart | Lets you filter the data in the DataSet based on the values in a given column. Different chart types appear for columns depending on the data type for that column. For text (string) columns, a horizontal bar appears, divided into segments for each unique name in the column. You can filter the data in the DataSet to a particular name by clicking on that section in the bar. (Names appear as hovers when you mouse over a section.) In the following example, the user could filter the DataSet to show only the data for “Delivery Truck” by clicking on the corresponding bar.
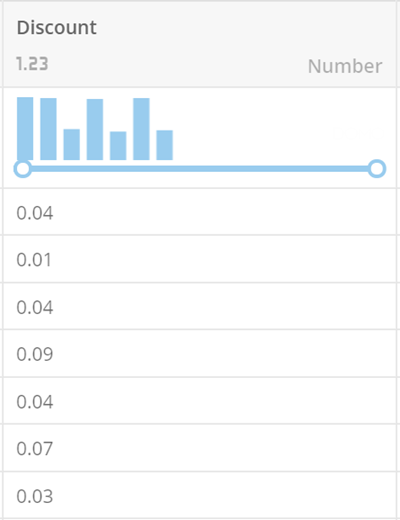
For date/date-time and value columns, a vertical bar chart with a horizontal slider appears. You can filter the data in the DataSet to show dates or values above or below a certain threshold by sliding the bar accordingly. In the following example, the user could filter the DataSet to show only values of .05 or higher by sliding the bar to “.05.”
|


Schema subtab
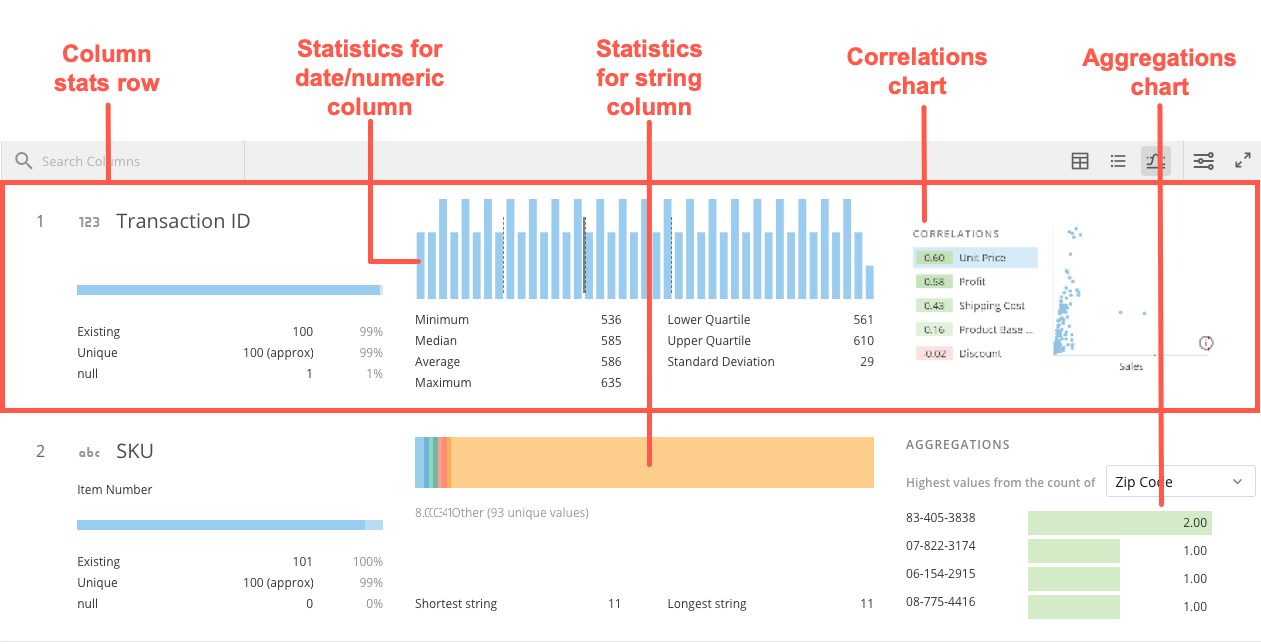
In the Schema subtab, you can reorder the columns in your DataSet, add descriptions and tags, etc. The following screenshot shows the components of the Schema subtab: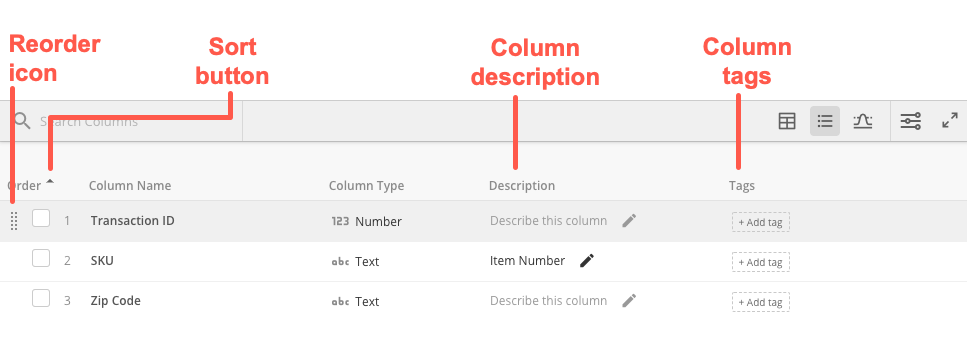
Name | Description |
|---|---|
Search field | Lets you search for and filter to a specific column or columns in the DataSet. |
Reorder icon | Lets you change the order of columns in this DataSet by clicking and dragging a column into the desired position. Note that this option is only available for the “Index” column, and only when sorting has been applied to that column. So, for example, you could not sort by column name and then click and drag to reorder columns. |
Sort button | Lets you apply an ascending or descending sort to the column. Note that this sort only changes the order of column names in the Schema subtab so you can more easily find what you’re looking for. It does not change the actual order of columns in the DataSet. If you want to change the column order, use the Reorder icon. |
Column description | Lets you enter a description for a column or edit an existing description. |
Column tags | Lets you enter search tags for this column. For more information about tags, see the table under DataSets and DataFlows Tabs . |
Name | Description |
|---|---|
Search field | Lets you search for and filter to a specific column or columns in the DataSet. |
Column stats row | Shows statistics for a given column. |
Statistics for date/numeric column | Shows automatically-generated statistics for a numeric or date/date-time column. Available statistics include minimum, maximum, average, median, upper and lower quartile, and standard deviation. |
Statistics for string column | Shows automatically-generated statistics for a string column. Available statistics include shortest string, longest string, and average length. |
Correlations chart | Shows correlations for numeric and date/date-time columns. For the given numeric or date/date-time column, you can select any other numeric column and see how the two columns correlate. |
Aggregations chart | Shows the five highest aggregated values of the given column from the selected column. If the selected column is numeric, the values are summed; otherwise the values are counted. For example, in the above screenshot, the user has chosen to view the five highest aggregated sales values for the “Customer Name” column. He does this by selecting “Sales” in the Aggregations dropdown for the “Customer Name” column. |
Cards tab
The following screenshot shows the components of the Cards tab: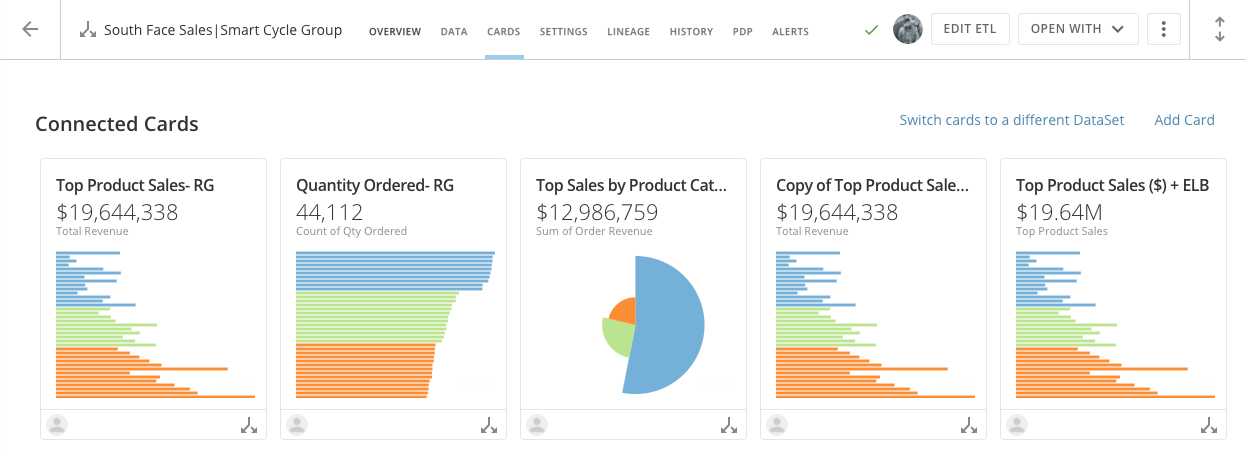
| Name | Description |
|---|---|
Connected Cards | All cards powered by this DataSet. You can click on a card to see the Details view for that Card. |
Switch cards to a different DataSet option | Allows you to move all of the Cards powered by this DataSet to another DataSet. This option appears if you are the owner of the DataSet, depending on the DataSet type. For more information, see Connecting Cards to a Different DataSet . |
| Add Card option | Lets you power up a Card using the DataSet. Select the DataSet from the list to use it in powering a card. By default, the Card is added to the Overview page in Domo. This option may not appear, depending on the DataSet type. For more information about this option, see Powering a Visualization Card with Data . |
History tab
In the History tab, you can see a listing of all of the times this DataSet has been updated. This tab shows the start and end times for all updates, the amount of time the update took (duration), whether the update was scheduled or manual, and the result of the update (successful or failed). You can also see the amount of time that has transpired since the last successful run, the average update duration, and the overall success rate. Finally, for any history item, several actions are available by mousing over the row and clicking the wrench icon. The following screenshot shows an example of a History tab for a DataSet called “Compensation Costs”: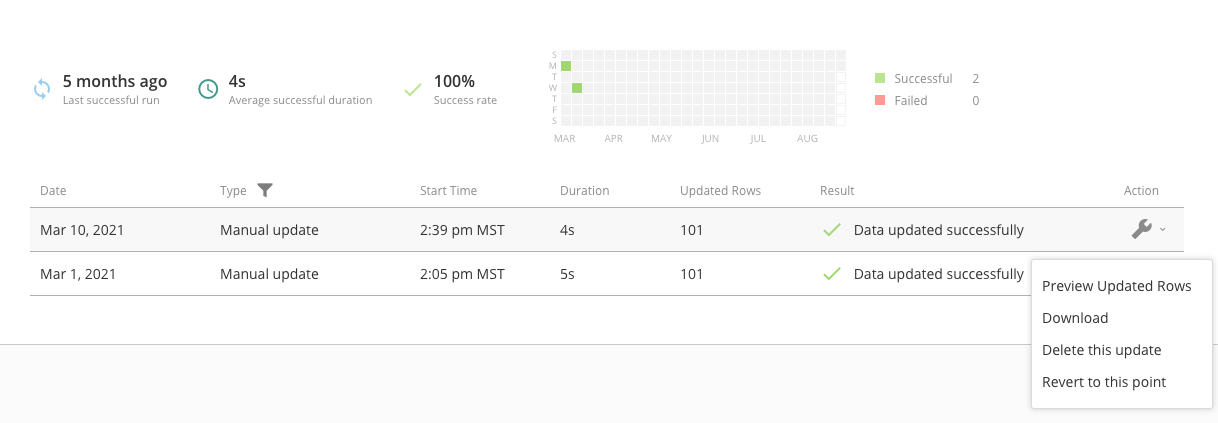
- Preview updated rows . Displays the rows in the DataSet that were changed when this update occurred.
- Download . Downloads the data in this version of the DataSet as a flat text file that can be opened in an Internet browser or word processor.
- Delete this update . Deletes this version of the DataSet from your history.
- Revert to this point . Reverts the DataSet to this version.
Settings tab
In the Settings tab for a DataSet, you have access to the options used to set up this DataSet, similar to the view that appears when you initially configure a connector DataSet. Click a row to open up the settings in that row for viewing and editing. Settings categories may differ between connectors. For more information about connector configuration options, see Adding a DataSet Using a Data Connector .
Data Lineage tab
In the Data Lineage tab for a DataSet, you can see the DataSets that have been combined and/or transformed through DataFlows or DataFusion to yield this DataSet. The Data Lineage interface in Data Center is the same as that used for a DataSet in Analyzer. For more information, see Viewing the Lineage of a DataSet in Analyzer .Personalized Data Permissions (PDP) tab
Personalized Data Permissions (PDP) allow you to create a customized experience for each Domo user through the definition of Entitlement Policies. Using Entitlement Policies, you can filter data in a DataSet for specified users and/or groups. For more information, see Personalized Data Permissions (PDP) . The following screenshot points out the most important parts of the PDP tab: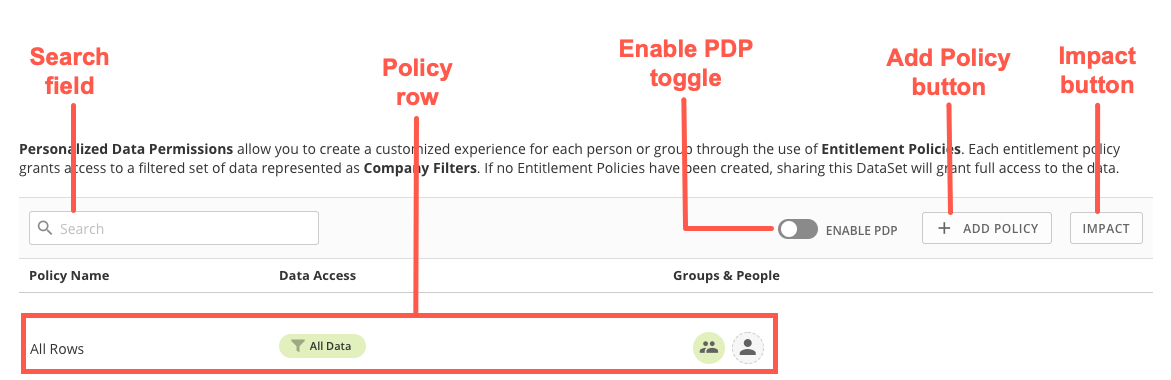
Name | Description |
|---|---|
Search field | Lets you search for existing policies that have been added to this DataSet. |
Policy row | Shows information about a policy, including its name, the rows of data it provides access to, and the groups and users the policy has been applied to. |
Enable PDP toggle | Activates/deactivates this PDP policy. |
Impact button | Opens a list of cards and alerts that will be affected by PDP policies on this DataSet. |
Add Policy button | Lets you add a new PDP policy to this DataSet. For more information about adding a PDP policy, see Personalized Data Permissions (PDP) . |
View Details (DataFlows)
When you click the name of a DataFlow or click > View Details , a page appears showing details for the DataFlow. This page is divided into tabs— Settings , DataSet s , History , and Versions . For more information about these tabs, see Viewing DataFlow Details .
Editor view (MySQL and Redshift DataFlows)
The following screenshot shows you the main components of the Create / Edit DataFlow view for a MySQL or Redshift DataFlow.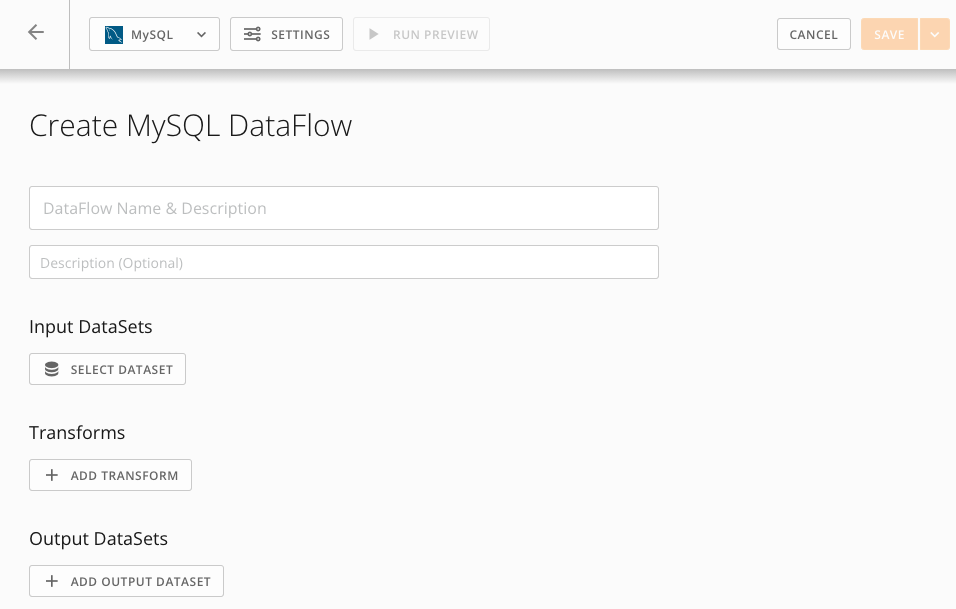
Name | Description |
|---|---|
DataFlow Type & Info | When collapsed, this panel displays the type of DataFlow and the schema. When expanded (by clicking |
DataFlow Name & Description | Allows you to specify a name and description for this DataFlow. |
Input DataSets | Allows you to select one or more existing DataSets for use in creating DataFlows. You can choose as many input DataSets as you want. For any given transform or output, you can use one, some, or all of the DataSets you select here. This is essentially a storage area for DataSets you may potentially use. You cannot manipulate data in the DataSets at this stage. You also cannot select the same input DataSet twice in the same DataFlow. You can click an input DataSet you have added to see a preview of the DataSet. |
Transforms | Allows you to manipulate data in your input DataSets using SQL statements before you make your final manipulations in the Output DataSets stage. The Transforms stage is optional. All input DataSets you have selected are available for use in transforms. |
Output DataSets | Allows you to specify how your input DataSets are to be combined to produce one or more output DataSets. This interface is almost the same as that of Transforms. However, while adding transforms is optional, the Output DataSets stage is required; otherwise you cannot save your DataFlow. All input DataSets and transforms you have selected/created for this DataFlow are available to be used in your Output DataSet SQL. |
Save buttons | Allow you to save this DataFlow. Two separate buttons are available: Save and Save and Run . Save saves changes you have made to this DataFlow and adds it to the DataFlows listing in the Data Center but does not generate a DataSet (or, if you are editing an existing DataFlow, it does not update the output DataSets). Save and Run saves changes to the DataFlow and adds it to the DataFlows listing in the Data Center and runs the script for the DataFlow to output a DataSet (or update the output DataSets if it has already been created). |
 ), this panel displays information about the RDS instance for this DataFlow, including the host name, schema, user name, password, and port number. You can copy and paste this information into any SQL tool, including Workbench.
 Editor view (Magic ETL DataFlows)
For times when you need to transform your DataSets before you can make compelling visualizations, you can use Magic ETL DataFlows to transform multiple DataSets into a new DataSet that you can use to power up cards. Magic ETL DataFlows let you visually define and sequence operations to transform your Domo DataSets—without learning SQL or leaving Domo. For information about the Magic ETL DataFlow tiles, see all of the following:- Creating a Magic ETL v2 DataFlow
- Magic ETL v2 Tiles: DataSets
- Magic ETL v2 Tiles: Text
- Magic ETL v2 Tiles: Dates and Numbers
- Magic ETL v2 Tiles: Utility
- Magic ETL v2 Tiles: Filter
- Magic ETL v2 Tiles: Combine Data
- Magic ETL v2 Tiles: Aggregate
- Magic ETL v2 Tiles: Pivot
- Magic ETL v2 Tiles: Scripting
- Magic ETL v2 Tiles: Data Science
- Magic ETL v2 Tiles: Performance
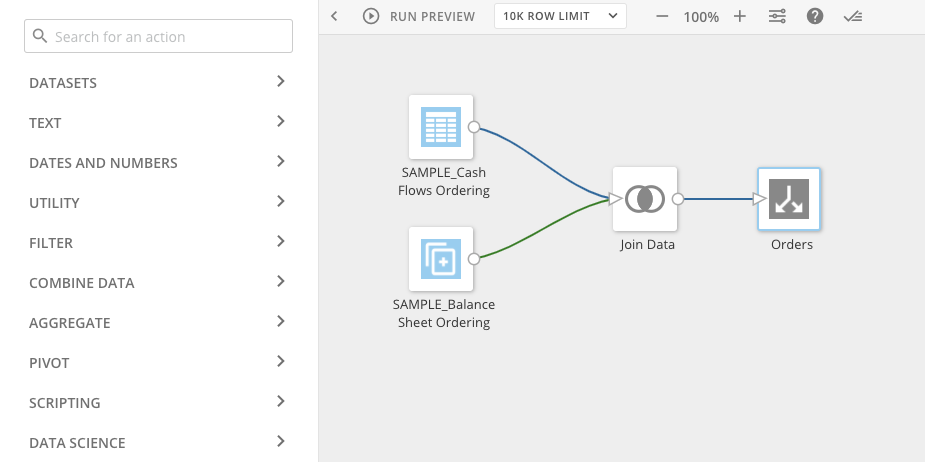
Element | Description |
|---|---|
Action pane | Contains the transform tile you can drag and drop into the canvas to use in transforming data. For more information, see the following topics:
|
Canvas | Contains your transformation flow—the sequence of tiles to perform on input DataSets to save as an output DataSet. You connect tiles to sequence them and select tiles to configure them. |
| Lets you preview the transform tile. |
| Lets you schedule the Magic ETL DataFlow to run whenever the specified input DataSets change. |
| Lets you show or hide the Magic ETL DataFlow checklist, which shows a list of things to do before you can save a Magic ETL DataFlow. |


ETL DataFlow checklist
The checklist shows a list of things to do before you can save a Magic ETL DataFlow. You can show the checklist by clicking at the top of the canvas. The following example illustrates essential tasks to perform before saving a Magic ETL DataFlow.
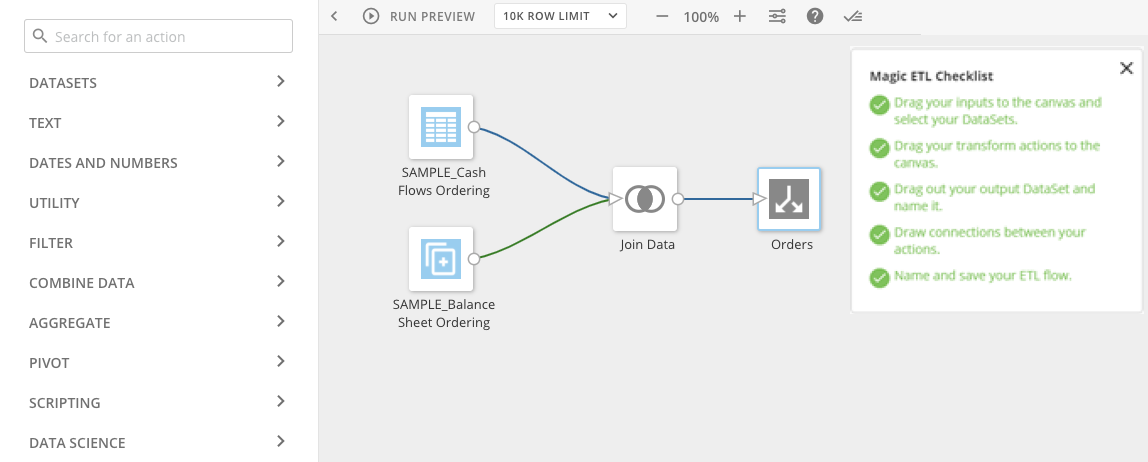
- Create a Magic ETL Dataflow.
- From the tiles pane on the left, drag Input DataSet tiles to the canvas and select the DataSets to transform.
-
Drag transform tiles to the canvas.
For more information, see the following topics:
- Creating a New Magic ETL DataFlow
- New Magic ETL Tiles: DataSets
- New Magic ETL Tiles: Text
- New Magic ETL Tiles: Dates and Numbers
- New Magic ETL Tiles: Utility
- New Magic ETL Tiles: Filter
- New Magic ETL Tiles: Combine Data
- New Magic ETL Tiles: Aggregate
- New Magic ETL Tiles: Pivot
- New Magic ETL Tiles: Scripting
- New Magic ETL Tiles: Data Science
- New Magic ETL Tiles: Performance
- Drag an Output DataSet tile to the canvas, then name the DataSet to be output from your transformed data.
- Draw connections between the transform tiles to build a DataFlow that defines and sequences operations to transform the input DataSets (clean, aggregate, join, etc.).
- (Optional) Configure settings for when the DataFlow runs. By default, the DataFlow runs in the cloud whenever the specified input DataSets change.
- Name and save your Magic ETL Dataflow.
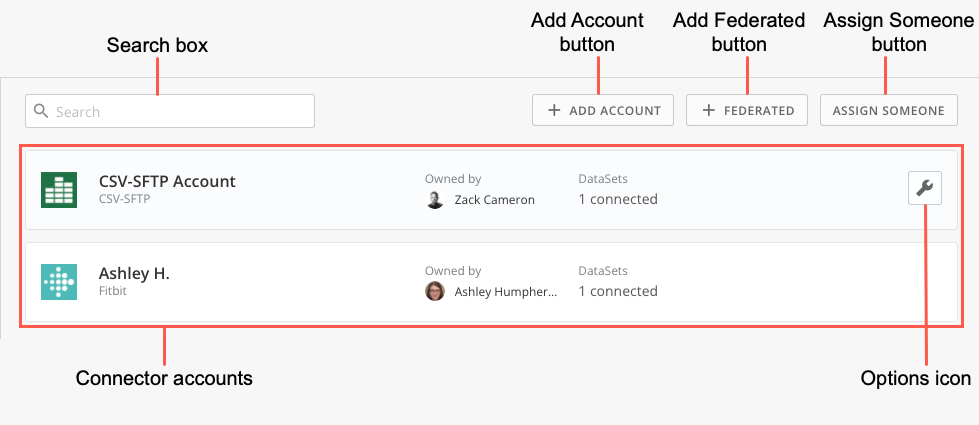
Accounts tab
In the Accounts tab, you can manage third-party system accounts associated with DataSets in Domo. You can view accounts associated with DataSets; add, edit, or delete accounts; and associate DataSets with another account. In the Accounts tab, you can- add user accounts for different connectors (similar to a DSN)
- view a list of user accounts you have added
- disconnect accounts you have added
- share accounts with other users
- see DataSets you have access to
- transfer DataSets from one account to another account
- change account associations
- rename accounts
- visually identify DataSets needing attention
- edit credentials for accounts that require manual authentication (as opposed to those that use OAuth)
Name | Description |
|---|---|
| Search box | Lets you filter the accounts in the list. |
Add Account button | Lets you add a new user account to this list. |
Add Federated button | Lets you add a Federated account to this list. |
Assign Someone button | Lets you assign someone to create an account for a specific Connector. |
Connector accounts | Provide information and options for all accounts you have used to connect to data sources, including the account name, the usernames or handles you use to connect, and options such as share, reconnect, etc. For each account, you can ado the following:
|
Options icon
| Lets you access various options for working with this account, including the following:
|


Beast Mode Manager tab
In the Beast Mode Manager tab in the Data Center, you can view statistics on Beast Mode usage as well as perform various actions, such as editing formulas, locking and unlocking calculations, deleting unwanted calculations, and so on. The following screenshot calls out the most important parts of the main screen (Overview) of the Beast Mode Manager tab: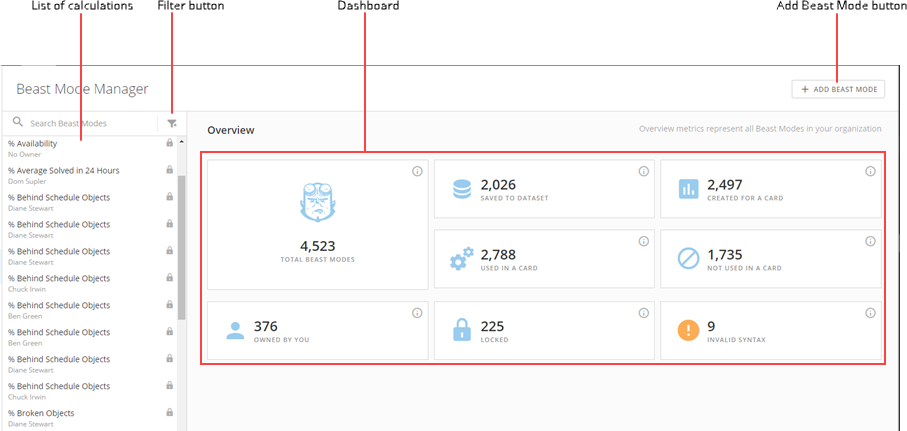
Name | Description |
|---|---|
List of calculations | Shows all of the calculations in your Domo instance you have access to see. You can filter the list by entering search keywords in the Search Beast Modes field; by filtering on certain criteria such as name, owner, or status (valid or invalid); or by clicking on a card in the Dashboard. If you are the calculation owner or have a role with the Manage All Cards, Pages and Apps (App Studio) grant enabled, you can also select calculations in this list. When you select calculations, a wrench menu appears at the top of the list. This menu contains actions you can apply to calculations in bulk, such as locking/unlocking calculations, changing calculation owners, and duplicating calculations to other DataSets. |
Filter button | Lets you filter the calculations in the list by any of a variety of criteria, including Beast Mode type (Card of DataSet), locked or unlocked status, owner, etc. |
Dashboard | Shows cards for various Beast Mode-related statistics, such as the total number of Beast Mode calculations, the number saved to a DataSet, the number not being used in a Card, etc. You can click on a card to filter the calculations list accordingly; for example, clicking “Locked” filters the list to show all calculations that have been locked. |
Add Beast Mode button | Lets you add a calculation to a selected DataSet. |
Name | Description |
|---|---|
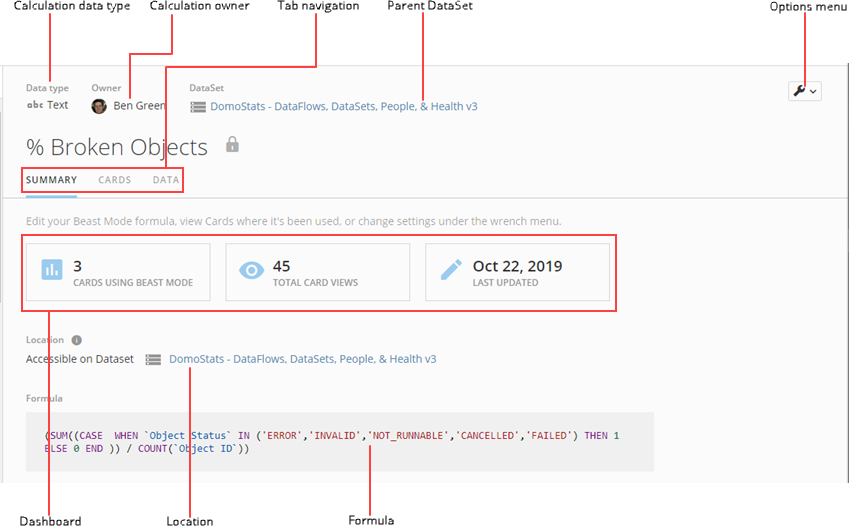
Calculation data type | Shows the data type for this calculation, such as String, Number, Date, etc. For more information about data types, see Understanding Chart Data . |
| Calculation owner | Shows the owner of this calculation. By default, Beast Mode calculations on a DataSet are owned by the DataSet owner and calculations on a Card are owned by the Card owner. You can change the owner of a Beast Mode calculation by selecting Change owner in the options menu. |
| Tab navigation | Lets you switch between the three views of the details view for this calculation. Summary , shown in the screenshot, provides an overview of the calculation. Cards displays all Cards this calculation is used in. Data shows the calculated column together with the column(s) it is derived from. |
| Parent DataSet | Shows the parent DataSet for the calculation or, if the calculation is found on a Card rather than a DataSet, it shows the parent DataSet for the Card. You can click on the DataSet to open its details view . |
| Options menu | Provides access to actions you can take on this calculation, including the following:
|
| Dashboard | Shows you statistics for this calculation, including the number of Cards using the calculation, the total number of views of the Card, and the last update date. |
| Location | Shows the Card or DataSet this calculation is built on. You can jump to the details view for the Card or DataSet by clicking on the link. |
| Formula | Shows the formula for this Beast Mode calculation. You can edit the calculation by mousing over it and clicking the pencil icon. For more information about editing Beast Mode, see Transforming Data Using Beast Mode . |
- domo.write_dataframe(df, output_dataset)
- domo.write_dataframe(df, output_dataset, update_method=“REPLACE”)
- domo.write_dataframe(df, output_dataset, update_method=“APPEND”)
- domo.write_dataframe(df, output_dataset, update_method=“UPSERT”, update_key=column_name)
- domo.write_dataframe(df, output_dataset, update_method=“PARTITION”, partition_name=’Example Name’)
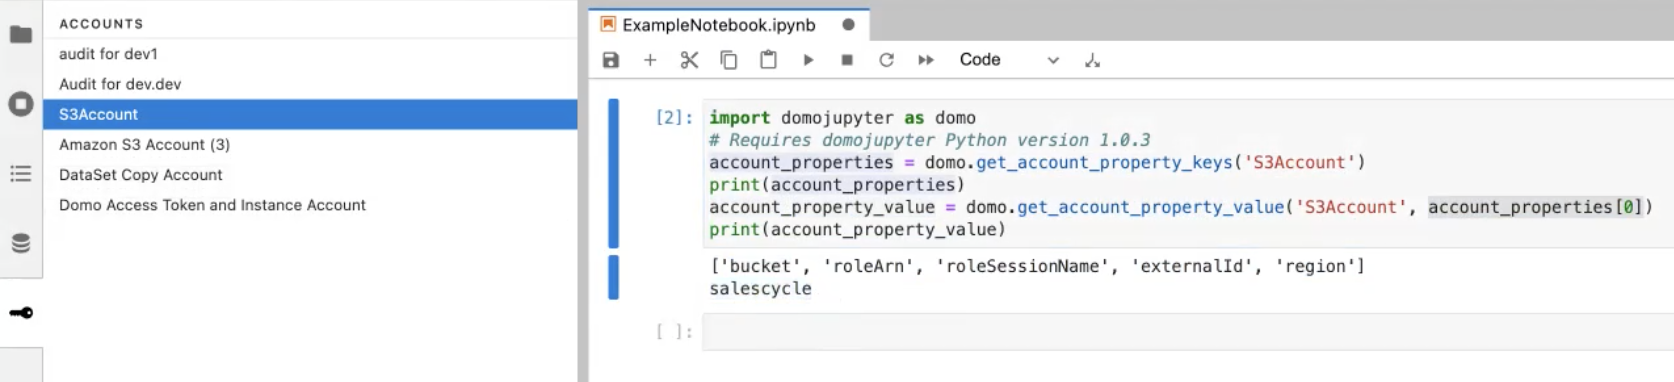
update\_key column, or the UPSERT fails.Use Accounts
Third-party accounts can be referenced in a Jupyter Notebook using the domojupyter library. This library provides useful functionality to interact with Domo within Jupyter. Before account keys and values can be accessed, your workspace must have an account. If you are creating a new workspace, see the earlier section, Creating a Workspace. If your workspace already exists but doesn’t have a third-party account attached, follow the steps below:- In Jupyter Workspaces, locate your workspace from the list. You can search and filter by owner.
-
Hover over your workspace. The
 Manage Workspace menu displays.
-
Select the
 Manage Workspace menu and choose Edit.
- In the Edit Jupyter Workspace view, select Accounts > Add Account and select a third-party account.
- After making your selection, select Save Workspace.
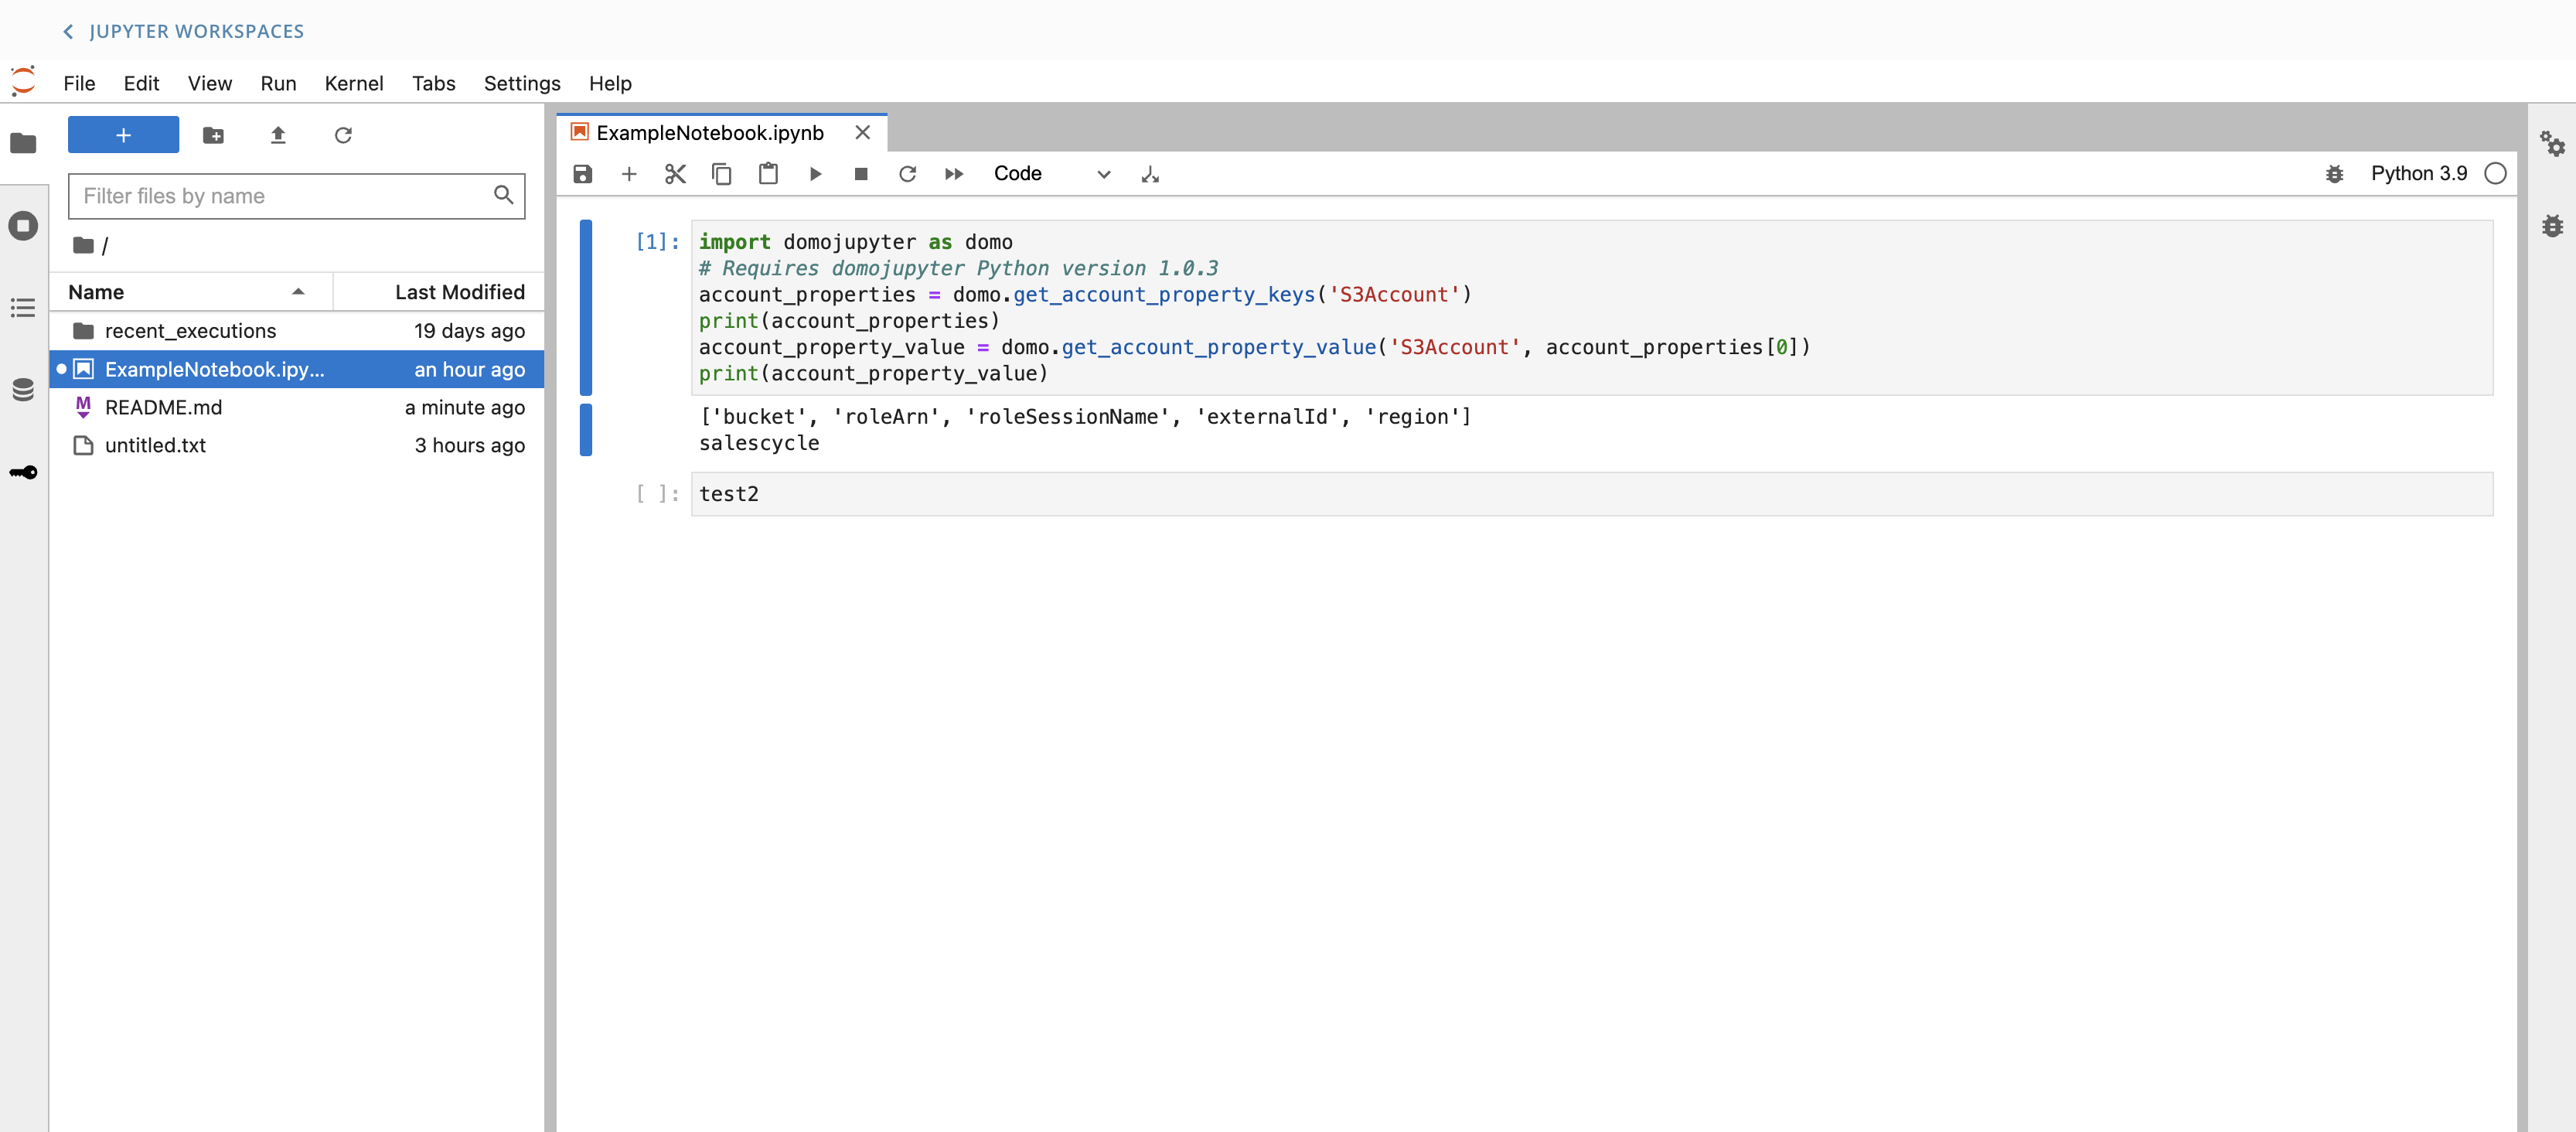
- The following commands can be used to get account information:
domo.get_account_property_value('account')will return the specific value assigned to a property on your account.domo.get_account_property_value('account',account_properties[0])will return all properties that exist in an account.
Install and Use Libraries
Libraries can be installed in the Jupyter workspace by opening a terminal and executing the appropriate commands. An example command to install the Seaborn library isconda install seaborn -y. Once installed, these libraries can be imported and used within the Jupyter Notebooks.
See the example below:

Usage Monitoring
You can monitor Jupyter usage within Domo. As a prerequisite, you need to be assigned either the default Admin role or a custom role with the View Usage Metrics and Manage Jupyter Workspaces grants. Follow the steps below to create a custom role with usage-based billing access.- Clone an existing role such as the default Admin role.
- Remove any grants from the cloned role that are not needed for a billing admin.
- Add the View Usage Metrics and Manage Jupyter Workspaces grants to this role.
- In the navigation header, go to More > Admin .
- On the Admin screen in the Company settings menu, select Usage.
-
Go to the
Jupyter Compute tab.

FAQ
Can I install Plugins?
Can I install Plugins?
Can I trial the feature?
Can I trial the feature?
Does Domo offer data science services?
Does Domo offer data science services?
How do I change the kernel?
How do I change the kernel?
Can I reset the kernel?
Can I reset the kernel?
 Manage Workspaces menu displays. Choose Restore Kernel Defaults from the options. All instances must be stopped to fulfill this action.
Do I need to know how to code using Python or R programming languages in order to use a Jupyter notebook?
Do I need to know how to code using Python or R programming languages in order to use a Jupyter notebook?
I'm experiencing issues integrating third-party libraries.
I'm experiencing issues integrating third-party libraries.
Can I integrate Jupyter Workspaces with GitHub?
Can I integrate Jupyter Workspaces with GitHub?
The minimum Python version available is 3.9, what is Domo's policy of depreciating supported versions?
The minimum Python version available is 3.9, what is Domo's policy of depreciating supported versions?
There are four categories of workspace available, each with the same four CPUs. What will be the configuration of each category in production?
There are four categories of workspace available, each with the same four CPUs. What will be the configuration of each category in production?
How can I host a service that will continuously run as an API?
How can I host a service that will continuously run as an API?
Does Domo have any code copilot/assistant?
Does Domo have any code copilot/assistant?