The 5 elements of a data analytics strategy
Every business owner knows that data is important. By understanding and analyzing the data your company produces, you can make better decisions that will help improve your bottom line.
In a world that is increasingly driven by big data, it is essential to have a data analytics strategy in place. A strong data analytics strategy can help you make sense of the vast amount of data available to your business and use it to improve your decision-making.
So, what goes into creating a data analytics strategy? When considering data analytics, there are five essential elements you need to take into account:
1. Collecting data
2. Data analysis
3. Reporting results
4. Improving processes
5. Building a data-driven culture
In this article, we will break down each of these five essential elements and discuss how they can help you create a successful data analytics strategy for your business.

Defining data analytics
Before we dive into the five elements of a data analytics strategy, it is important to first define what data analytics is.
Data analytics is the process of inspecting, cleansing, transforming, and modeling data with the goal of discovering useful information, informing conclusions, and supporting decision-making.
Data analytics can be used to help businesses in a number of ways, including:
Improving operational efficiency
Data analytics can help you identify inefficiencies in your business processes and workflows. Once these are identified, you can work to fix them, which can lead to improved efficiency and reduced costs.
Optimizing marketing campaigns
Data analytics can help you understand how customers interact with your brand and which marketing channels are most effective at driving conversions. By understanding this data, you can optimize your marketing campaigns for better results.
Identifying new business opportunities
Data analytics can help you spot trends in customer behavior and market demand. This information can be used to develop new products or services that meet the needs of your customers.
Improving customer service
Data analytics can help you identify areas where your customers are experiencing difficulty and identify solutions. This can help you provide a better customer service experience and improve customer loyalty.
The five elements of a data analytics strategy
Now that we have defined data analytics, let’s take a look at the five essential elements of a data analytics strategy.
1. Collecting data
The first stage of any data analytics process is data collection. This involves gathering all of the data that your business produces, both internally and externally. The data can come from a variety of sources, including:
- Operational systems: This includes data from systems such as ERP, CRM, and HRMS.
- Transaction data: This includes data collected from point-of-sale systems, e-commerce platforms, and financial databases.
- Web and social media data: This includes data from web analytics tools, social media platforms, and online surveys.
- Machine data: This includes data from sensors, RFID tags, and other connected devices.
Data collection can occur in a variety of ways, depending on the type of data and the source.
For example, operational data can be collected manually by extracting it from systems or automatically by using extract, transform, and load (ETL) tools.
Transaction data can be collected by downloading it from financial databases or automatically by integrating it with payment processing providers.
Web and social media data can be collected by setting up tracking scripts or using social media monitoring tools. And machine data can be collected by using sensors to track activity or integrating with IoT platforms.
Once the data is collected, it needs to be cleansed and standardized so that it is ready for analysis. This process involves removing duplicate records, correcting errors, and formatting the data so that it can be easily analyzed.
2. Analyzing data
After the data is collected and cleansed, it is ready for analysis. Data analysis is the process of using statistical techniques to examine the data and extract useful information.
The goals of data analysis vary depending on the type of data and the business objectives. For example, data analysis can be used to:
Identify patterns and trends
Data analysis can help you identify patterns in customer behavior or market demand. This information can be used to make better decisions about products, pricing, and promotions.
Predict future outcomes
Data analysis can be used to build predictive models that can forecast future events. This information can be used to make decisions about inventory, staffing, and marketing.
Detect anomalies
Data analysis can help you identify unusual patterns that may indicate fraud or other problems. This information can be used to take corrective action to prevent losses.
Data analysis is typically done using data mining and statistical analysis software. These tools allow you to examine the data in different ways and extract useful information.
3. Reporting results
After the data has been analyzed, the results need to be reported. This step is important because it allows you to share the insights with others and make decisions based on the findings.
There are a variety of ways to report data analytics results, depending on the business and the audience. Some common methods include:
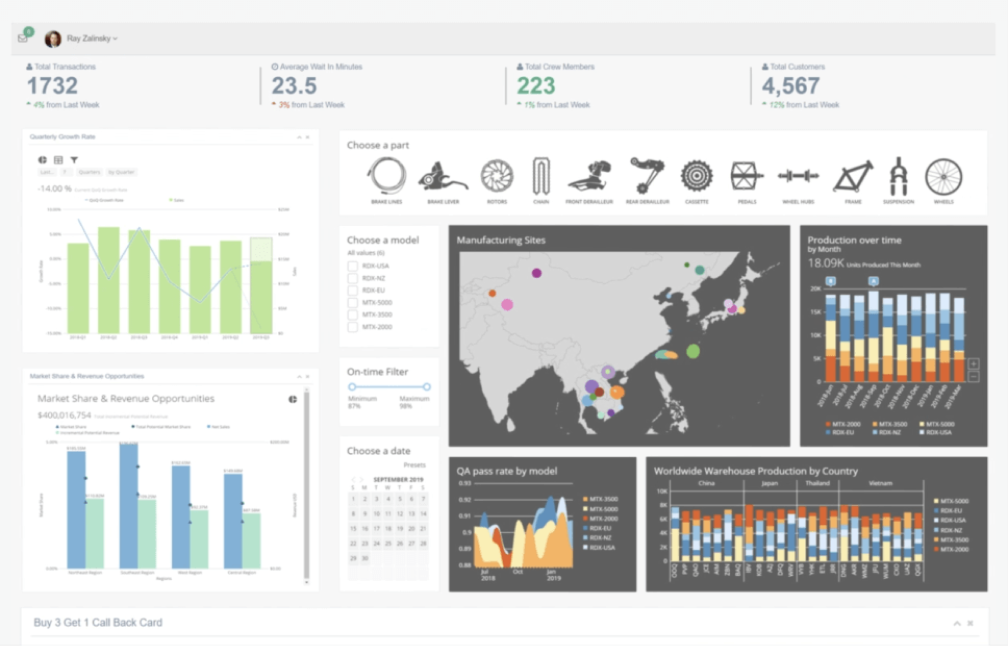
Presenting findings in a dashboard
A data dashboard is a graphical representation of the data that allows you to quickly see the key insights. Dashboards can be used to monitor performance over time or compare different data sets.
Generating reports
Reports are a written summary of the data that includes all the key findings. Reports can be used to share the results with others who may not be able to interpret the data themselves.
Creating infographics
Infographics are visual representations of the data that are designed to be easy to understand. Infographics can be used to communicate the results of data analytics to a wide audience.
The ultimate goal of reporting is to ensure that the data is being used to make better decisions. By sharing the results with others, you can ensure that the data analytics is having a positive impact on the business.
4. Improving processes
Data analytics is an ongoing process, not a one-time event. After you have collected and analyzed the data, you need to take action to improve the process.
This step involves making changes to the way data is collected, processed, and analyzed. It may also involve changing the way decisions are made based on the data.
By constantly improving the process, you can ensure that data analytics is having a positive impact on the business.
5. Building a data-driven culture
Data analytics is not just about the data. It’s also about the people who use the data to make decisions.
To be truly data-driven, you need to build a culture in which everyone uses data to make decisions. This includes training employees on how to use data analytics and giving them access to the tools they need.
It also involves creating a culture of accountability in which everyone is responsible for using data to make better decisions.
Here are some tips on how to build a data-driven culture:
Make data accessible
Give employees access to the data they need to make decisions. This includes making the data available in a format that is easy to understand — such as visualizations or reports.
Train employees on how to use data
Teach employees how to use data analytics tools and how to interpret the data. This will help them make better decisions based on the data. Empower them to use data to solve problems.
Encourage a data-driven mindset
Encourage employees to think about how data can be used to improve the business. This includes asking them to identify problems that can be solved with data and suggesting ways to use data to improve processes.
Create a culture of accountability
Hold employees accountable for using data to make better decisions. This will help ensure that data analytics is having a positive impact on the business.
Turning data analytics into action
Now that you have a data analytics strategy, it’s time to turn it into action. This involves putting the plan into practice and making sure that the data is being used to improve the business.
There are a few key things to remember when turning data analytics into action:
1. Be patient
Data analytics is an ongoing process, not a one-time event. It may take some time to see results from the data analytics strategy.
2. Be flexible
The data analytics strategy may need to be adjusted as new data is collected and new insights are gained. Be prepared to change the plan as needed.
3. Be persistent
Data analytics is not a “set it and forget it” type of strategy. It requires constant attention and effort. Don’t give up if the data doesn’t immediately produce results.
4. Be data-driven
Use data to make decisions about the business. Data should be used to improve processes, inform decision-making, and solve problems.
5. Be accountable
Hold employees accountable for using data to make better decisions. This will help ensure that data analytics is having a positive impact on the business.
Conclusion
For businesses that want to improve their bottom line, data analytics is essential. By understanding and analyzing the data, businesses can make better decisions that will help improve their bottom line. With the right data analytics strategy, you can turn data into actionable insights that will help your business succeed.