Saved 100s of hours of manual processes when predicting game viewership when using Domo’s automated dataflow engine.
Watch the video

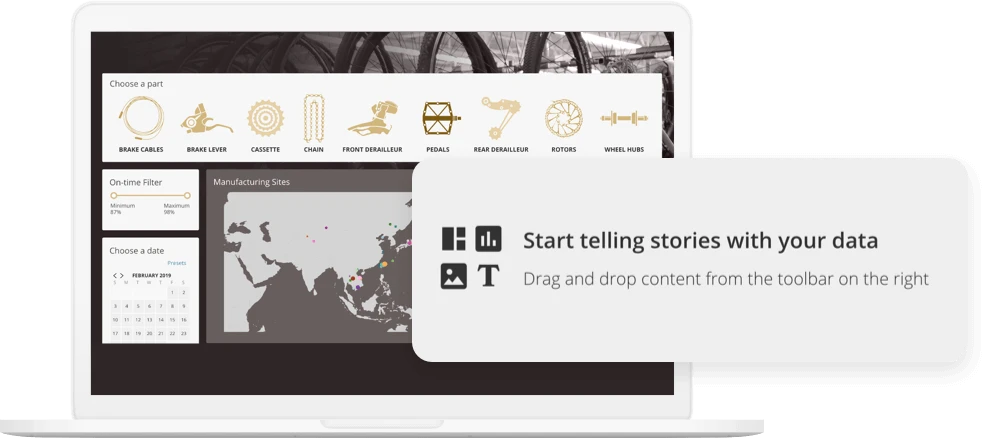
Tell a story with your data.
Customizable dashboards, called Stories, help guide data analysis, so your data can tell the story you want it to tell.
Customizable dashboard layouts put you in charge of how your information is received by others.
With Domo Stories, your story is consistent no matter the device, whether it’s mobile, tablet, or computer.
Set up your dashboard with interactive filters so individual users can drill down to the data and view they need to see.
You’re in charge of how your information is viewed with customizable dashboard layouts.
Help users know what to focus on by emphasizing specific metrics and how your data relates to other information.
Create the layout you want with drag and drop cards, headers, and templates, and use in-line notebook cards to deliver commentary about data on the same page.


Resize and reorder cards to make certain KPIs more prominent, change dashboard and card colors, and add background colors to imprint your brand on your dashboard.

Communicate key takeaways with dynamic display options and tools:
You’re in charge of how your information is viewed with customizable dashboard layouts.
Help users know what to focus on by emphasizing specific metrics and how your data relates to other information.

When you design a dashboard with Stories, the format is automatically adapted to be mobile-compatible, so you deliver a consistent narrative whenever and wherever the dashboard is accessed. And all exports of your dashboard maintain the same layout.


Use flexible filtering to make your data interactive and easy to explore:
Choose what filters you apply to certain cards, so you can have different filters on cards on the dashboard.
Link to other dashboards in Domo or external websites.
Drill down on cards right from the dashboard to keep dashboard context front and center.

BI & ANALYTICS FEATURES
Explore the data experiences that trigger better, faster decisions across every team and function.
Create interactive, easy-to-use visualizations that support "Aha!" moments.
Modernize your reporting with real-time data that everyone can self-serve.
Build low- or pro-code apps that improve operational processes.
Securely share data and insights outside your organization.
Deliver actionable data experiences that scale with an AI framework you can trust.