The benefits of using dashboard visualization tools
Dashboard visualization tools are being used at more companies every day, as these tools allow business owners to collect data on current trends and measure progress towards goals.
By using these tools, you can improve your data analysis and decision-making, which can help your business achieve greater success. But how do they work?
In this article, we will take a closer look at how dashboard visualization tools work, explain what dashboard visualization tools are, and discuss the benefits of using them.

What are dashboard visualization tools?
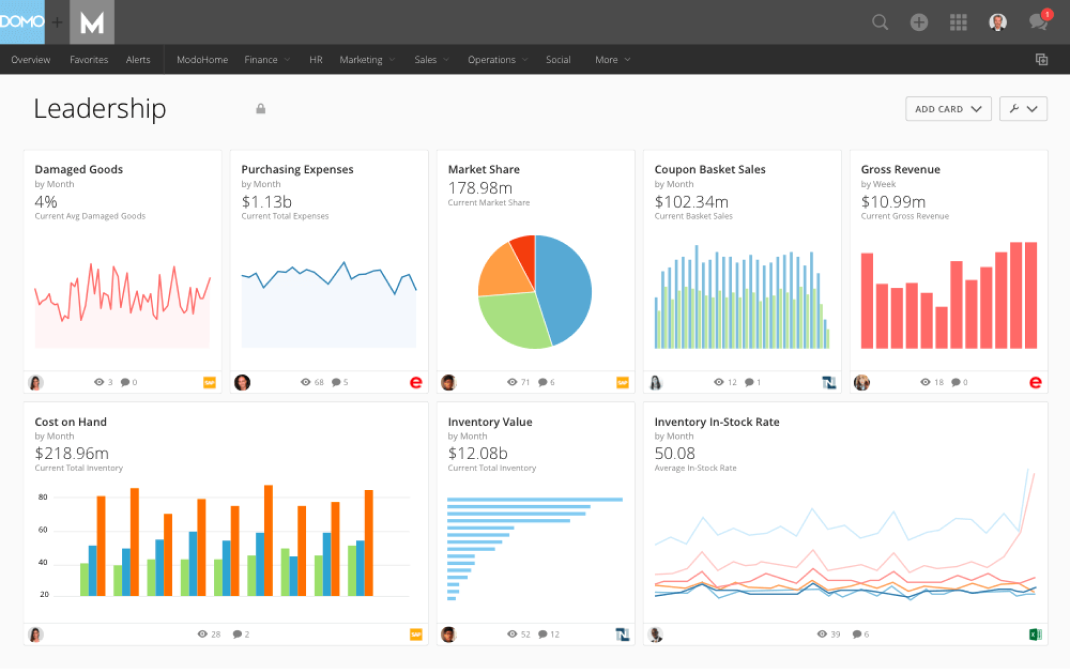
The main purpose of a dashboard visualization tool is to transform data into useful information. This information is displayed using a visual element such as a chart or graph.
These tools are used to collect data from various sources, organize that data into one location, and then display the collected information in a visual format that is easy for users to understand.
Dashboard visualization tools are helpful because they allow you to see all of your company’s essential metrics at once so you can quickly identify any problems or issues.
The data is also displayed to make it easier for you to understand and work with, as opposed to just seeing numbers and figures spread out over various reports.
What are the benefits of using dashboard visualization tools?
Dashboard visualization tools offer a variety of benefits that can help you to better your company.
Here are just a few of the many benefits that come with using dashboard visualization tools:
1. Dashboard visualization tools can help your company save time
Instead of spending hours searching for reports, figures, and spreadsheets when you need information on specific metrics or targets, you can instead turn to your dashboard visualization tool.
Just the process of creating a dashboard can help you create a single source of data where everything is stored in a central location.
2. Dashboard visualization tools can help you make better decisions
Dashboards can help you make data-driven decisions that are based on relevant information.
These tools provide a clear breakdown of important metrics, which makes it easier for you to monitor progress and identify when problems arise in your business’s system(s) or operations.
3. Dashboard visualization tools can help improve your company’s workflow
Dashboards can also help improve your company’s workflow from a managerial standpoint and help you gain a better understanding of exactly how your business is operating on a day-to-day basis. Teams can have access to the same dashboard and work together to understand what the visualizations are telling them.
By utilizing dashboard visualization tools, managers receive timely updates about important metrics, which can help them make necessary adjustments to their business’s operations to achieve better results. They can also be alerted when certain metrics change, prompting them to look at the dashboard and drive decision-making based on those insights.
4. Dashboard visualization tools can feature customizable views
One of the main benefits of dashboard visualization tools is the ability to customize views based on your personal needs.
For example, you can choose which metrics are displayed on your dashboard and how they are grouped together.
Dashboards can feature various views so you can view information about different metrics side-by-side, compare data over time, or even use multiple types of charts to display the same metric at once.
This means that you can customize dashboards to include any information that is relevant to what you’re looking for.
5. Dashboard visualization tools can feature single sign-on (SSO) and two-factor authentication
Since dashboard visualization tools are online applications, many of them have the ability to let you sign in using single sign-on authentication instead of multiple usernames and passwords.
In other words, you can sign in with a single username and password to gain access to all of your accounts.
This feature is especially helpful for businesses that have employees using the tool across various departments or locations because it allows everyone to access vital information without remembering multiple passwords.
In order to avoid security risks, some dashboards also offer two-factor authentication.
Two-factor authentication requires a username and password in addition to a code that is sent to your mobile device, which makes it more difficult for someone else to access your information.
6. Dashboard visualization tools can feature customizable collaboration options
In addition to single sign-on, dashboards can also allow business teams and managers to collaborate with each other easily.
This is helpful for employees that need input from team members on certain projects or tasks while also allowing business teams to discuss any problems or roadblocks they may be experiencing in real-time.
Many of these tools allow you to add online web links, images, and files so you can easily share information with co-workers.
7. Dashboard visualization tools can keep data safe and secure
Dashboards can store your company’s data in a central location so that you always have access to the latest information whenever it’s needed most.
There are also options available that allow you to back up your data if needed, which means you never have to worry about losing track of important metrics or information.
This feature is especially beneficial for businesses that need to stay up-to-date on their systems’ previous performance, such as in the case of equipment maintenance and repair.
By keeping detailed logs and records of past issues, companies can avoid problems that could lead to costly repairs and even equipment failure.
Turning data into actionable information
Dashboards are one of the easiest ways to visualize your company’s data, which means you can easily understand how your business is operating on a daily basis.
These tools allow you to gain insight into areas that need improvement as well as track performance so you know exactly where to focus your company’s attention.
For example, if your dashboard shows that sales have dropped over the last week, you can look into what products are being viewed or bought most often and then adjust your business accordingly.
With dashboard visualization tools, you don’t have to waste time trying to figure out what your business’ biggest problems are. All of the information you need is right in front of you so you can address issues and work towards having a better overall performance for your company.
Consider researching possible dashboard visualization tools that your business could benefit from using. By finding the best solution, you can effectively boost your company’s success.