The basics of business intelligence dashboards
Business intelligence (BI) has continued to play an important role in business decision-making across all industries. BI uses a technology-driven method to track metrics about the firm, the customer, and the market. In simple terms, BI is all about utilizing the data generated by your company’s many operations and sectors. This information is then analyzed and presented to you to help you understand and obtain vital insights into how your company is doing. As a result of these actionable insights, you’ll be able to make more educated and intelligent business decisions that will help your company adapt and grow.
The amount of data generated every day in today’s modern corporate world is simply amazing. Without having to look at numerous reports, business intelligence enables firms to gain a complete overview of their business performance. Business intelligence tools enable you to display your data in a way that is readable, understandable, and edible.
What is the definition of a business intelligence dashboard?
Would you prefer it if data was presented to you in the form of dull Excel spreadsheets or through interactive, visually appealing dashboards?
Because the human mind is physiologically wired to interpret visuals better than simple text and numbers, it is quite likely that you would choose the second option. Effective data visualization is essential for making your data understandable.
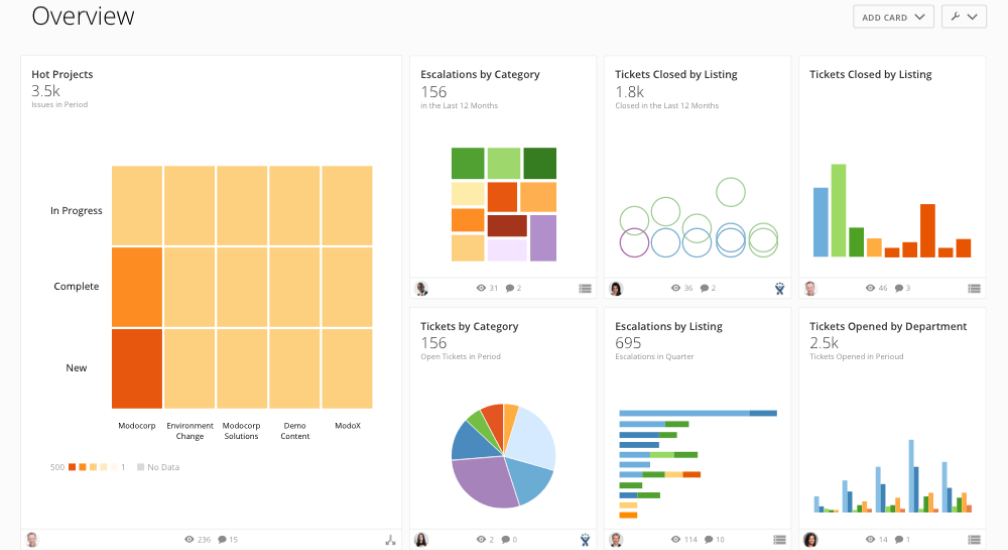
Like a car dashboard that shows speed, fuel level, and even outside temperature, a BI dashboard shows a glimpse of your company’s performance. Your business measurements, KPIs, and other essential data points for decision-making can all be displayed in a BI dashboard. Monitoring and benchmarking the KPIs can assist you in assessing the performance of your organization and identifying areas that may require additional attention or inquiry.
BI dashboards are an important aspect of any business intelligence strategy. They should be designed and created specifically for analyzing data from diverse sources in order to expedite the decision-making process. Users can develop dynamic web-based dashboards to evaluate, present, and exchange data with internal and external stakeholders. BI dashboards are simply an interactive approach to visualizing different kinds of data for business purposes.
Features and components of a BI dashboard
BI dashboards are a technology-driven technique for analyzing and visualizing data in a straightforward manner. BI dashboards are a collection of charts and graphs that give viewers a 360-degree perspective of a company’s performance. Business users can utilize BI dashboards to get a consolidated view of crucial and connected KPIs and patterns for better decision-making and tactical planning.
BI dashboard solutions come with several features that may be utilized to automate tasks and enhance usability and aesthetic appeal.
Customizable and interactive interface: The customizable interface allows users to create a dashboard that meets their requirements. BI reports are more dynamic than static Excel reports because they draw data in real time directly from the sources.
Built-in standard dashboard templates: Templates speed up the creation process and increase aesthetic appeal by facilitating the organization of visualizations within dashboards.
Data source connections: BI dashboards can connect to data lakes, data warehouses, data marts, and other data sources to consolidate data for analysis.
Data visualizations: Users can use a variety of data visualization charts to illustrate different performance measures, ranging from simple line and bar charts to more complicated graphs like scatterplots and heatmaps.
Drill-down capabilities: By clicking on a data visualization, users may get a closer look at a more detailed version of the data. This grants consumers access to extra visualizations or data tables, which are typically organized in a hierarchical structure that allows them to go down numerous levels.
Data filters: Data filtering capabilities within visualizations enable users to specify geographical settings, date and time ranges, and other characteristics to receive a more complete perspective of the processed data.
Tooltips and text boxes: Dashboards frequently feature pop-up information tooltips and standalone text boxes that clarify visible data and provide further context regarding analytics results.
Sharing capability: BI dashboards make it easy to share the findings of your research with others. This guarantees that knowledge is disseminated throughout the organization, encouraging collaboration.
All of these characteristics result in long-term benefits for BI dashboard users and the enterprise as a whole.
Benefits and drawbacks of a business intelligence dashboard
BI dashboards have proven their worth to users of all kinds in a variety of situations. Technical users can deal with the data beneath the dashboard to create custom queries or do data-level filtering. Non-technical users can also interact with the dashboard by exploring the visualizations at the dashboard level. In summary, regardless of their technical expertise, any end user can stay up to date with data, analytical measurements, and KPIs.
Advantages of a BI dashboard
- Trend identification: Dashboards give business users the ability to spot and analyze promising trends, isolate and remedy bad trends, and provide forecast insight.
- Improved communication: The wonderful thing about BI dashboards is that they are simple to share with clients, colleagues, and any other important internal or external stakeholders to drive cooperation.
- Accurate forecasting: Finding patterns and trends by analyzing historical and present data is possible. Predictive analytics algorithms can also provide you with a glimpse into the future by forecasting key factors.
- Real-time insights: You must stay current on KPIs and other important measures in order to make informed and precise judgments. BI dashboards provide you with the most up-to-date and relevant data in real time. When BI tools allow you to update everything with only a few clicks, there’s no need to manually dig through endless databases to find what you’re looking for.
- Freedom and flexibility: The centralized and entirely portable nature of BI dashboards allows users to view and analyze data from a variety of devices, including a smartphone, desktop, laptop, or other device, 24 hours a day, 7 days a week.
Drawbacks of a BI dashboard
- Bad designs: Dashboard designs that are overly bright and cluttered might be difficult to understand and use.
- Difficult to use: Drill-down methods to probe the data beneath surface metrics are sometimes challenging for BI users to create.
- Expensive: Some BI dashboard tools are costly and are targeted at larger enterprises.

Designing a business intelligence dashboard: best practices
Business insights are presented in an easy-to-understand way in an effective BI dashboard design. The following are best practices that can be applied to the creation of business intelligence dashboards in general.
- Determine your most important reporting requirements while keeping end users and decision-makers in mind. This will allow you to concentrate on certain areas of the relevant data and tailor it to their requirements, abilities, and aspirations.
- Include all relevant information and context in the processed data. Stakeholders can easily comprehend the trends if none of the important information is left out.
- Highlight KPIs by creating an engaging story. This will assist you in presenting your findings in an inspiring manner while also capturing the interest of your audience.
- Present accurate data that will prompt action. Making sure the visualization presents actionable insights aids stakeholders in making informed decisions.
- Avoid using a dashboard that is extremely bright and cluttered. A dashboard with too many graphic elements will be difficult to perceive and grasp.
Conclusion
Making well-informed decisions leads to more opportunities, technical advancement, and overall success. BI dashboards disseminate information throughout the organization, allowing any person to make better-informed, data-driven decisions.