How Machine Learning Can Improve Your BI Processes

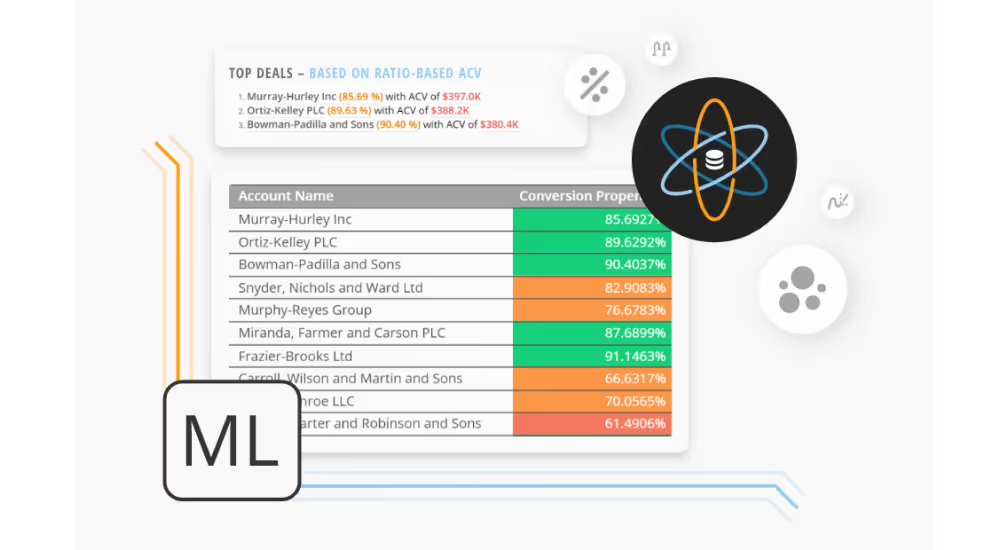
Adding machine learning to your BI strategy can improve forecasting accuracy, automate routine analytical work, and surface insights no human would find manually. This article covers the core ML capabilities most relevant to BI teams, including predictive analytics, anomaly detection, and AI agents, along with practical guidance on building the data foundation these tools require and choosing a platform that brings it all together.
Key takeaways
Here are the main points to keep in mind.
- Machine learning transforms BI from static reporting into dynamic, predictive intelligence that anticipates business needs
- Three primary ML applications in BI include predictive analytics, qualitative data analysis, and intelligent automation
- Successful ML implementation requires a governed data foundation where quality data feeds accurate models
- AI agents can now automate entire analytical workflows, from data preparation to insight delivery
- Organizations combining ML with BI see measurable outcomes in shorter decision cycles and operational efficiency
The evolution from traditional BI to ML-enhanced intelligence
Business intelligence has earned its place as a foundational capability for data-driven organizations. But the conversation has shifted. Nobody asks whether a company needs BI anymore. The real question: can your BI keep pace with the speed and complexity of modern decision-making?
Machine learning makes that possible. By layering ML capabilities onto existing BI infrastructure, organizations move beyond dashboards that show what happened. They get systems that predict what's coming and recommend what to do about it.
This shift is already underway. As enterprises invest in AI initiatives, they're discovering that AI needs two things to deliver value: governed data and a way to distribute insights into the workflows where decisions happen. BI provides both. The result is a new category of intelligence, one where predictions, anomalies, and recommendations flow directly into the reports and alerts teams already rely on.
Why organizations are investing in ML for BI
The traditional BI model centered on dashboards and reports served organizations well for years. Analysts built visualizations. Stakeholders reviewed them. Decisions followed. But this model has a ceiling. It depends on humans to spot patterns, ask the right questions, and connect dots across data sources.
Machine learning removes that ceiling.
ML algorithms can process millions of data points, surface patterns no human would find, and generate predictions at a scale manual analysis cannot match. Modern platforms make these capabilities accessible to teams without dedicated data science resources. You don't need a PhD in statistics to get started.
The investment case is straightforward. Organizations that combine ML with BI act on insights sooner, forecast with greater accuracy, and automate routine analytical work so teams can focus on higher-value decisions.
What is machine learning in a BI context?
Business intelligence refers to the tools, processes, and practices organizations use to collect, integrate, analyze, and present business data. Machine learning is a subset of artificial intelligence where algorithms learn patterns from data and improve their accuracy over time without being explicitly programmed for each scenario. Together, ML and BI enable organizations to move from understanding historical performance to predicting future outcomes and automating data-driven decisions.
Machine learning refers to a broad category of analytical techniques that use algorithms and other learning tools to iterate on successes. A practical example makes this clearer.
Consider a sales team trying to forecast quarterly revenue. Traditional BI would show historical sales trends, pipeline stages, and conversion rates. A manager could review those dashboards and make an educated guess about where the quarter will land.
Machine learning changes that equation entirely. An ML algorithm can analyze years of historical deals (win rates by segment, seasonal patterns, rep performance, deal velocity, and dozens of other factors) to generate a probability-weighted forecast. As actual results come in, the algorithm learns from its successes and mistakes, refining its predictions over time.
Initially, the algorithm might not be very good at making those judgments. But by providing feedback, you sharpen the algorithm's decision-making. If it is consistently overestimating deals in a particular segment, that pattern gets incorporated into future predictions.
Over time, this process of making predictions, comparing them to reality, and learning from the gaps makes the algorithm increasingly accurate. Eventually, it can forecast with a precision that manual analysis simply can't match.
This simple loop (algorithm trained on initial data, makes decisions based on past experience, learns from mistakes) is the core of any machine learning use case.
How ML algorithms learn from business data
The feedback loop may seem simple, but machine learning has all sorts of use cases. Any business in any industry can find places where machine learning can streamline their operations, solve persistent problems, and find new insights.
The ML capabilities most relevant to BI fall into four categories:
- Predictive analytics: Forecasting future values based on historical patterns, such as sales projections, demand planning, or customer lifetime value estimates
- Anomaly detection: Identifying data points that deviate from expected patterns, like unusual spending, inventory discrepancies, or sudden changes in customer behavior
- Natural language processing: Interpreting unstructured text data, including customer feedback, support tickets, survey responses, and social media mentions
- Optimization: Recommending actions that maximize or minimize a target metric, such as pricing strategies, resource allocation, or marketing spend distribution
Each capability maps to specific BI artifacts that teams already use:
Traditional BI vs ML-enhanced BI
Understanding the difference between traditional and ML-enhanced BI helps clarify where machine learning adds value. The shift isn't about replacing dashboards. It's about making them more useful.
The analytics mode distinction matters. Traditional BI excels at descriptive analytics, summarizing what happened and why. ML-enhanced BI adds predictive analytics (what will happen) and prescriptive analytics (what should we do about it). Organizations do not have to choose one or the other.
{{custom-cta-1}}
Where machine learning improves BI processes
Businesses don't need to invest in expensive machine learning tools to access machine learning benefits. Many BI tools offer machine learning capabilities that can help businesses build algorithms and find insight.
Machine learning can be complicated. If a business had to work on their algorithms from scratch, it'd be very difficult. Luckily, there are already established use cases for machine learning that businesses can use to jumpstart their machine learning success.
These use cases meet needs that are common among businesses and allow companies to get analytics that would be impossible otherwise. Just because these use cases are somewhat simple doesn't mean they aren't effective.
Each use case follows a consistent pattern: data flows from source systems into an ML model, the model generates predictions or classifications, the system writes those outputs to governed tables, and BI tools visualize the results in dashboards or trigger automated actions.
Predictive analytics that anticipate business trends
Many businesses already access predictive analytics as part of their basic BI strategy. While these basic predictive capabilities can be useful, machine learning can provide even deeper insight.
Predictive analytics uses a business's historical and current data to provide insight into how things will trend in the future. They're used for techniques like forecasting, which predicts future data, and what-if scenarios, where you can see how a change in one metric could affect other ones.
If a business does not use machine learning to power its predictive analytics, the insights it gets will be limited. Their business forecasts might be derived from simple best-fit lines, for example.
For real predictive power, businesses need to use machine learning. Machine learning can delve much deeper into the relationships between data points, which allows for much more accurate predictive models than best-fit lines. Teams sometimes assume that more input variables automatically mean better predictions. In practice, adding irrelevant or poorly correlated features can actually degrade model accuracy. Start with the variables you have strong reason to believe matter, then expand thoughtfully.
Once a business has used machine learning to build predictive models, those models become more effective every time teams compare their predictions with actual outcomes. A success is obviously best, but a machine learning algorithm learns even more from a failure.
Over time, these models can improve their accuracy and help businesses prepare for likely outcomes with more confidence.
Organizations typically integrate ML predictions into BI through one of four patterns. Batch scoring writes predictions to a governed table on a schedule (daily churn scores, weekly demand forecasts, or monthly customer health ratings). In-warehouse ML runs scoring directly in the data warehouse using Structured Query Language (SQL) functions. Real-time application programming interface (API) scoring calls a model endpoint when immediate predictions are needed, such as fraud detection at the point of transaction. BI-native ML uses built-in platform capabilities that handle the model training and scoring without requiring separate infrastructure.
The batch scoring approach is the most common starting point because it's the most straightforward to govern and audit. The scoring job writes predictions to a table with timestamps, model version identifiers, and primary keys that link back to source records.
Qualitative data analysis and natural language processing
Often, businesses want to analyze data that's not in a helpful numerical format. This might be text data, images, or other data formats that can't be easily expressed numerically.
In those cases, businesses need to find some way to transfer the implications of their non-numerical data into a numerical format so that they can analyze it in conjunction with other streams of data.
In the past, this could be a long and time-consuming process. Someone might have to manually parse all the qualitative data and then present it in a way that others can understand.
Machine learning can streamline this process and allow businesses to really put their qualitative data to work. With simple processes, it can analyze non-numerical data and produce signals teams can use for insight.
One of the most popular machine learning techniques for this situation is called sentiment analysis. It allows businesses to glean the overall opinion of a body of text. This approach is particularly useful for things like customer feedback, reviews, and other measures of marketing success.
In sentiment analysis, a machine learning algorithm parses a piece of text and then picks out words that express an opinion. From there, it decides whether those words express a positive or negative opinion. For example, it might pick out the words "awesome," "terrific," and "good," and decide that the text has a positive opinion.
Modern NLP capabilities go well beyond basic sentiment. AI assistants can now summarize lengthy documents, extract key themes from thousands of support tickets, categorize open-ended survey responses, and even generate narrative explanations of data trends. These capabilities turn unstructured data into structured insights that flow directly into BI dashboards.
This can allow businesses to effectively gauge customer opinion based on things like reviews or customer feedback. From there, they can do further analysis on the reviews to find commonalities between them and figure out what people's specific complaints are.
Intelligent automation through AI agents
Algorithms can help to automate all sorts of processes that otherwise would need manual input. In some situations where people follow consistent decision rules, an algorithm can support that judgment and reduce manual input.
For example, a sales team might score their leads based on certain criteria. Using elements like the deal size, time since contact, and other important information, sales teams guess how likely it is that their leads will convert.
Using lead scoring, sales teams can then choose which leads to prioritize and which to dedicate fewer resources to. After all, a business doesn't want to dedicate all of their sales resources to a lead that has a low chance of converting.
Machine learning can automate the lead scoring process. By looking at the qualities of leads that have converted before, an algorithm can then figure out which qualities are good indicators of conversion for future deals.
Data drives lead scoring instead of guesswork and intuition. Teams can apply the same technique in many business situations and replace guesswork with automated data insights.
Modern AI agents take automation further. Rather than just scoring leads, an agent can monitor pipeline data, identify deals at risk, draft personalized follow-up messages, and alert reps when action is needed. All without manual intervention. The key is that humans set the objectives and constraints while machines handle the execution.
Automation only works when people trust the outputs. That means surfacing not just the prediction or recommendation, but the reasoning behind it. When an alert fires, the recipient should see the top factors that drove the decision: which metrics changed, by how much, and why that matters. These reason codes and driver explanations help non-technical stakeholders understand and act on ML-generated insights rather than dismissing them as black-box outputs.
How ML outputs appear in BI dashboards
Understanding how ML predictions actually show up in BI tools helps bridge the gap between data science and business analysis.
ML outputs typically land in scored tables, structured datasets that contain predictions alongside the identifiers and metadata needed to make them useful. A scored table for customer churn might include the customer ID, the churn probability, a risk band (high, medium, low), the date the score was generated, the model version that produced it, and the top three factors driving that customer's score.
BI tools query these scored tables just like any other data source. A dashboard might show a distribution of customers by risk band, a trend of average churn probability over time, or a filtered list of high-risk accounts with their driver explanations. The predictions become just another dimension to slice and analyze.
Organizations running ML at scale often maintain two types of dashboards. Business-facing dashboards show the predictions, segments, and recommended actions that inform decisions. ML health dashboards track the operational metrics that data teams need: data drift (are the input distributions changing?), prediction drift (are the outputs shifting unexpectedly?), coverage (what percentage of records are getting scored?), and accuracy over time (how well are predictions matching reality?).
Benefits of combining machine learning with BI
The value of ML-enhanced BI shows up in how decisions get made, not just in dashboard metrics.
Organizations that combine ML with BI typically see improvements across several dimensions:
- Decisions happen faster because predictions and anomalies surface automatically rather than waiting for someone to notice them
- Forecasts become more reliable as models learn from outcomes and adjust for patterns humans would miss
- Analysts spend less time on routine pattern-hunting and more time on strategic interpretation
- Unstructured data becomes actionable through automated classification and sentiment analysis
- Operational processes run more efficiently when ML handles scoring, routing, and alerting
The deeper benefit is decision quality. ML helps organizations validate their assumptions, catch misleading signals before they drive bad decisions, and communicate uncertainty to stakeholders. A forecast that includes a confidence interval is more useful than one that presents a single number as fact.
Timelier insights
Traditional analysis requires someone to ask the right question, pull the right data, and spot the right pattern. ML flips that sequence. Algorithms continuously scan data for anomalies, surface emerging trends, and flag items that warrant attention.
This shift from pull to push means insights arrive when they matter. Not when someone remembers to check. A sudden spike in customer complaints, an unusual pattern in expense reports, or a leading indicator of equipment failure can trigger an alert before the problem compounds.
More accurate forecasting and planning
Static forecasting methods (trend lines, seasonal adjustments, simple averages) work until they don't. They assume the future will look like the past, and they can't account for complex interactions between variables.
ML models handle complexity differently. They can incorporate dozens of input features, weight them based on predictive power, and adjust as new data arrives. A demand forecast might factor in weather patterns, promotional calendars, competitor pricing, and economic indicators simultaneously.
More importantly, ML models improve over time. Each forecast that gets compared to actual results provides feedback that refines future predictions.
Building the data foundation for ML success
Machine learning is only as good as the data it learns from. Organizations that rush into ML without addressing data quality often end up with models that are confidently wrong.
The principle is straightforward: garbage in, garbage out. A churn model trained on inconsistent customer records will produce inconsistent predictions. A demand forecast built on data with missing values will have blind spots. The work of making data AI-ready isn't glamorous, but it's essential.
Data quality and governance requirements
ML models need data that is clean, consistent, and governed. That means establishing clear ownership of data sources, enforcing data quality rules at ingestion, and maintaining documentation of what each field represents.
Governance extends to the ML outputs themselves. Scored tables should include metadata that supports auditability: timestamps showing when the system generated predictions, model version identifiers that let teams trace outputs to the source model, and primary keys that let teams join predictions back to source records.
Role-based access controls matter too. Not everyone who can view a dashboard should be able to see the underlying prediction scores, especially when those scores relate to sensitive decisions like credit risk or employee performance.
Personally identifiable information (PII) minimization is a baseline compliance practice. Teams should train models on the minimum personal data necessary and mask or exclude sensitive fields when they are not essential to prediction accuracy.
Connecting disparate data sources
ML models often need data from multiple systems: customer relationship management (CRM) records, transaction histories, support tickets, web analytics, and more. If that data lives in silos, building a training dataset becomes a manual integration project.
A unified data environment solves this problem at the foundation layer. When data from different sources flows into a common platform with consistent identifiers and definitions, ML pipelines can access what they need without custom integration work for each model.
The connectivity challenge extends to scoring pipelines. A model trained on unified data still needs access to that same data when generating predictions. If source systems are inconsistent or unreliable, scheduled scoring jobs can fail silently or produce stale outputs.
Organizations should think through refresh cadence and the tradeoffs involved. Precomputing predictions on a schedule (daily, weekly) keeps infrastructure costs manageable but means predictions may be hours or days old. On-demand scoring provides fresher results but requires more robust infrastructure and careful attention to latency.
How to implement ML in your BI strategy
Adding machine learning to an existing BI environment does not require a massive transformation. The most successful implementations start small, prove value, and expand from there.
Start with high-value use cases
Not every analytical problem needs machine learning. The best starting points are use cases where ML can deliver measurable improvement over current methods and where the business impact is clear.
Four use cases consistently deliver strong results for organizations new to ML:
- Sales forecasting: Predicting revenue by period, region, or product line with greater accuracy than trend-based methods
- Customer churn prediction: Identifying at-risk customers before they leave, enabling proactive retention efforts
- Inventory anomaly detection: Flagging unusual patterns in stock levels, orders, or fulfillment that warrant investigation
- Customer health scoring: Combining multiple signals into a single indicator of account status for customer success teams
Each of these follows the BI lifecycle: data flows from source systems, an ML model generates predictions, those predictions land in governed tables, BI tools visualize the results, and teams take action based on what they see.
Starting with batch scoring, precomputed predictions written to a governed table on a schedule, is the lowest-risk entry point. It does not require real-time infrastructure, the outputs are easy to audit, and the integration with existing BI tools is straightforward.
Choose a platform that unifies data and ML capabilities
The platform decision shapes what's possible. Organizations evaluating ML-enabled BI tools should consider several capabilities:
- Scoring method support: Can the platform handle both batch scoring and real-time predictions as needs evolve?
- Semantic layer and governance: Does it provide consistent metric definitions, role-based access, and data lineage?
- Explainability features: Can it surface the drivers behind predictions so people in the business understand and trust the outputs?
- Monitoring and drift detection: Does it alert when model performance degrades or input data patterns shift?
- Ease of use: Can teams without dedicated data science resources build and deploy models?
Platforms that unify data integration, governance, ML capabilities, and BI visualization in a single environment reduce the friction of getting predictions into the hands of decision-makers. When data, logic, and governance are defined once and reused everywhere, expansion strengthens the system rather than complicating it.
{{custom-cta-2}}
Choosing the right ML-enabled BI platform
Machine learning can provide businesses with an incredible number of novel insights. It helps to streamline operations, reduce guesswork, and provide access to data that'd be otherwise inaccessible.
Business intelligence helps organizations operationalize machine learning. Without a business intelligence tool, businesses may have a harder time operationalizing these data techniques at scale.
When evaluating platforms, watch for pitfalls that can undermine ML investments:
- Brittle model access: Does the platform query models directly at dashboard load time, or does it materialize predictions into governed tables? Direct model queries are slower, harder to audit, and more prone to failure.
- Missing model versioning: Can you trace a prediction back to the specific model version that produced it? Without versioning, debugging issues and maintaining compliance becomes difficult.
- Low actionability: Do predictions come with context that helps people act, or are they just numbers? A churn score without driver explanations leaves the recipient guessing what to do next.
You'll notice that most of these issues only surface after you've committed to a platform. If you're in the market for a BI tool or you're unhappy with the BI tool that you're currently using, choose a tool that's prepared for the future. Look for a platform that unifies data, governance, and ML capabilities so you can start with a single use case and expand as value compounds.