BI tools: How advanced visualizations can help business users
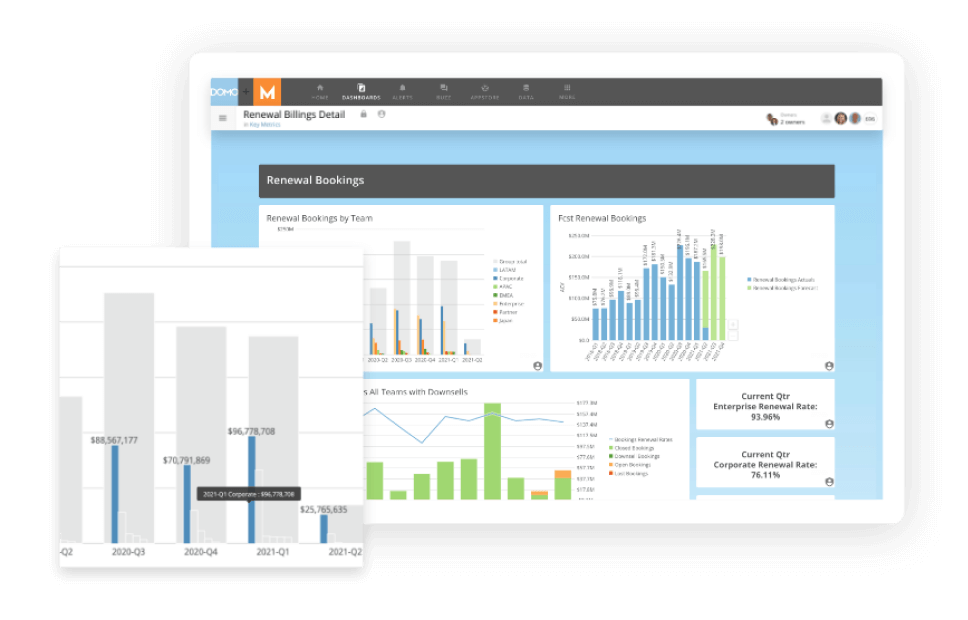
Visualizations are the bread and butter of business intelligence (BI) tools. By pulling data together into a cohesive, easily understandable format, BI tools help business users quickly identify patterns and trends in their data. With the right BI tool, businesses can supercharge their BI effectiveness and gain a competitive edge.
But what are advanced visualizations? And how do they differ from basic visualizations? And what can these capabilities offer businesses?
Read on to learn a bit more about these powerful BI tools and how they can help your business take the next step forward.

What is business intelligence (BI)?
Before we dig in, let’s revisit what business intelligence actually is.
BI is the process of transforming data into insights so that better business decisions can be made. It relies on a variety of tools and techniques to help make sense of data, including data science, statistical analysis, and predictive modeling.
BI tools offer advanced visualizations that can help business users quickly identify patterns and trends in their data. But many BI tools offer limited visualization capabilities. This is where advanced visualizations come in.
Advanced visualization
Advanced visualizations are the next step forward for BI tools, offering businesses more powerful ways to make sense of their data. This gives businesses the ability to tailor their BI tool to their specific needs, making it easier than ever to identify patterns and trends in their data.
What can advanced visualizations do for businesses?
Having the capability to customize your BI tools with advanced visualizations can offer businesses a number of advantages, including:
1. A more intuitive way to view data
With advanced visualizations, businesses can create graphs, charts, and other visuals that are more intuitive and easier to understand than basic visualizations. This can help business users quickly identify patterns and trends in their data in new and innovative ways.
Imagine the ability to tailor the way you view your data to fit your specific needs. With advanced visualizations, businesses can do just that. By customizing their BI tools, businesses can make their data work for them in new and powerful ways.
2. The ability to see more data at once
Advanced visualizations also offer businesses the ability to see more data at once. This can be especially helpful for businesses that have large data sets or for businesses that need to track multiple data sets simultaneously.
For example, custom visualizations can be created for a variety of tracking purposes, such as to track sales data across multiple regions or to track customer satisfaction data over time.
These visualizations can then be exported directly to applications that your business uses, such as Excel or Tableau, for further analysis. This gives businesses the ability to see more data than ever before and to make better, more informed decisions.
3. Greater insights into your deepest data
Advanced visualizations are built by connecting directly with your data sets. This means that businesses can utilize any data they have, no matter how deep it is buried in their system. Simply connect the custom visualizations to your database sets and watch as your data comes to life in new and insightful ways.
This also gives businesses the ability to use new data sources, such as social media data or web log data, to gain insights that they never before had access to. When you can connect to any data set, the possibilities for business insights are endless.
4. The ability to share data easily with others
Another advantage of advanced visualizations is that they can be shared easily with others, both inside and outside of your organization. This can be done by exporting the visualizations to a variety of formats in customizable ways.
For example, with the ability to use HTML or JavaScript code, businesses can create interactive visualizations that can be embedded directly into websites or applications. This gives users a more engaging way to view data and makes it easy for others to understand the insights that your business has uncovered.
Further advances, such as the ability to create custom menus and alter dashboards allows businesses to tailor their visualizations exactly to the needs of their users. This ensures that everyone from executives to front-line employees can easily access and understand the data that is most important to them.
5. The ability to keep up with the latest data trends
Finally, by using advanced visualizations businesses can stay ahead of the curve when it comes to data trends. The faster you can connect with real-time data in a practical and effective way, the better equipped your team will be to make decisions that could positively impact your bottom line.
Advanced visualizations give you the ability to monitor multiple data sets in real-time, quickly identify patterns and trends, and easily share insights with others. This puts businesses in a powerful position to make better decisions, stay ahead of the competition, and improve their bottom line.

Building your custom app with advanced visualizations
The benefits of using BI tools with advanced visualization capabilities are obvious. But how does your business go about building these custom apps?
There are a few different ways to do this:
1. Use a BI platform
Modern BI platforms have the ability to create advanced data visualizations. These platforms allow businesses to connect to their data sets, design their visualizations, and export them directly to the applications they use most often.
By using a builder platform, you can better control the design of your visualizations and ensure that they meet the specific needs of your business. Different builders will offer a variety of capabilities, so it is important to find one that fits your needs.
2. Leverage APIs
Another way to create custom visualizations is by using an API. This approach allows businesses to connect directly with their data sources, creating visualizations on the fly. This can be a powerful way to quickly get insights from data sets that are too large or complex to build in a builder platform.
However, this approach requires more technical expertise and can be difficult to scale. It is important to make sure that you have the resources in place to support this approach before you get started.
3. Use a combination of both
For businesses that want the best of both worlds, using a combination of an online platform and an API can be the perfect solution. This allows businesses to create custom visualizations with the ease of a builder platform and the flexibility of an API.
4. Custom development
Another option is to perform custom development to create your own advanced visualizations. This option gives you the most control over the design and functionality of your app but can be more expensive than using an online platform. Experienced developers can work with your team directly to understand your specific needs and build a solution that meets them.

Tips for getting the most out of your advanced visualization tools
Once you have decided to use BI tools with advanced visualization capabilities, there are a few things that you can do to make sure you get the most out of them:
1. Make sure everyone on your team is trained on how to use them
Advanced visualizations can be powerful tools, but they are only as good as the people using them. Make sure that everyone on your team understands how to use the tools and how to interpret the data.
2. Use them to answer specific questions
Advanced visualizations are not a magic bullet that will solve all of your problems. Instead, they should be used to answer specific questions that you have about your data. By focusing on specific questions, you can get the most out of your visualizations and use them to make better decisions.
3. Experiment with different types of data
Not all data is created equal. Try using different data sets with your advanced visualization tools to see how they perform. This will help you understand which types of data are best suited for visualizations and which are not.
4. Be prepared to change your visualization as your needs change
As your business changes, so too will your need for visualizations. Be prepared to change your visualizations as your needs evolve. This will ensure that you always have the right tools for the job and that you are getting the most out of your data.
When used correctly, BI tools with advanced visualization capabilities can be a powerful way to transform data into insights. By following these tips, you can make sure that you are using them to their full potential.
Conclusion
Business intelligence (BI) is the process of transforming data into insights for making better business decisions. New BI tools offer advanced visualizations that can help business users quickly identify patterns and trends in their data.
When used correctly, BI tools with advanced visualization capabilities can be a powerful way to transform data into insights. By following these tips, you can make sure that you are using them to their full potential.
