Partecipa all'AI + Data Tour per una formazione pratica, storie di clienti reali e incontri con gli esperti di prodotto Domo vicino a te.
Registrati ora

The choice of a big data analytics platform generally comes down to a single variable: knowing whether you need a storage and compute foundation, a business-oriented analytical layer, or both. This guide compares 11 options according to the scope of integration, the rigor of governance, and the fit with the ecosystem, in order to allow you to establish your selection more quickly.
Use this guide as a quick orientation before consulting the detailed descriptions below.
This list is not exhaustive and the tools are not subject to any ranking. The selection reflects editorial judgment based on market presence, analyst coverage, and evaluations from review platforms. As platform capabilities are constantly evolving, be sure to verify current features during your evaluation.
{{custom-cta-1}}
Big data analytics tools are software designed to manage, process, and analyze large volumes of data coming from very diverse sources. What distinguishes these tools from standard analytics software? Their ability to handle the three Vs of big data: volume (massive data sets often measured in petabytes), velocity (data arriving in real time or near-real time), and variety (structured data from databases alongside unstructured data coming from internet of things (IoT) devices, social networks, and documents).
These tools transform raw data into actionable information through methods such as real-time processing, predictive analytics, and interactive dashboards. They cover several layers of the data stack, from ingestion and storage through processing, visualization, and governance.Their value lies in their ability to help everyone,from executives to business professionals, make more informed and more effective data-based decisions, without requiring deep technical expertise.
In practice, big data analytics tools also help teams avoid the problem where “everyone has a different number” by ensuring consistent metric definitions through semantic layers and reusable KPI repositories. It is this consistency that transforms dashboards into trustworthy decisions.
The selection below covers enterprise platforms, cloud data warehouses, open source frameworks, and tools focused on visualization. Each presents its positioning, its fit, its strengths, and the context in which another category could better meet your needs.
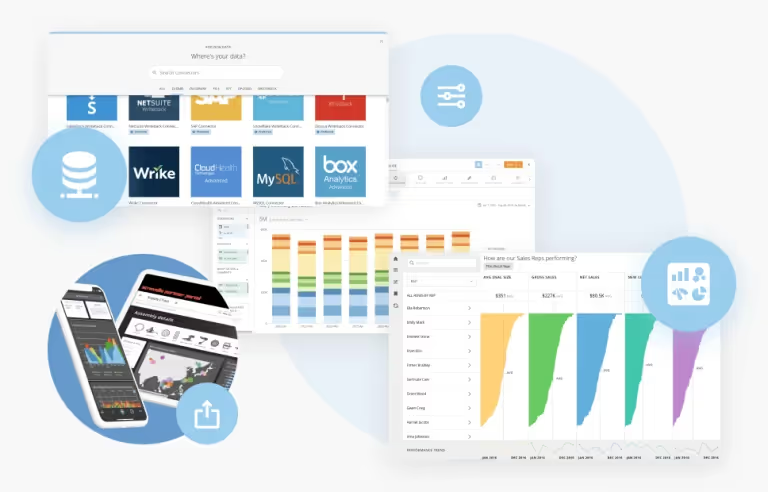
Domo is an agentic platform intended for the intelligent enterprise that combines data connectivity, transformation, visualization, and distribution within a single and governed layer.
Rather than separately assembling an integration tool, a semantic layer, and a BI front end, teams connect sources, prepare data, and publish governed results in a single environment. These results take the form of dashboards, embedded experiences, mobile views, alerts, or automated workflows, depending on where the decision is actually made.
Volume constitutes a practical test for any platform in this category. CAE USA, which develops simulation and training systems for defense, runs analyses on a vast history of data: “We have more than two billion rows of data, and we find that more than half has never been consulted,” said Dave Luna, Senior Technical Specialist for Data Analytics. CAE USA has about 300 regular users, including 75 power users. Pipeline performance matters just as much as raw volume. Dave Luna also stated: “Thanks to ETL 2.0, I reduced the duration of a flow that used to take 21 hours to only 17 minutes. From now on, the data set can be run as soon as the data is updated, and no longer only once per day.”
Strengths:
Fit context: Domo adopting a firmly cloud-first approach, organizations subject to strict on-premise requirements will need to carefully evaluate deployment arrangements. Teams that need only a single departmental dashboard may find the platform's scope greater than their immediate needs, even if each product constitutes a viable entry point without requiring the purchase of the entire platform.
Ideal for: organizations that bring together fragmented analytics tools within a single and governed control plane, truly usable by business teams.
{{custom-cta-2}}
Hadoop is the open source framework that made distributed processing of massive data sets viable, and it remains in service in organizations with significant on-premise commitments.
Clusters distribute storage and computation across standard hardware nodes, the method by which Hadoop initially solved the problem of data sets too large for a single machine. New analytical workloads now tend to migrate toward cloud data warehouses or lakehouses, but Hadoop continues to run legacy applications, archiving processing, and environments where data must not leave the premises. The concepts it introduced, notably distributed file systems and MapReduce-type parallelism, underpin a large part of the technologies that succeeded it.
Strengths:
Fit context: making good use of Hadoop requires dedicated infrastructure and in-depth operational expertise, from capacity planning to cluster optimization. Governance features rely on complementary projects rather than on a single integrated layer, which increases the integration burden. For teams without existing clusters or platform engineers, a managed cloud data warehouse generally offers comparable results with a much lower operational burden.
Ideal for: enterprises that have already invested in clusters, are subject to on-premise data residency requirements, and have the platform engineering staff needed to maintain them.
Spark is a distributed processing engine designed for in-memory computing, widely used as a transformation layer within modern data architectures.
It fits between storage and consumption, reading data from data lakes, lakehouses, or warehouses to prepare it for BI tools and machine learning models. Spark supports both batch and streaming workloads, and Spark Structured Streaming uses the same APIs as batch processing, which reduces the number of distinct code paths that engineering teams must maintain. Many commercial platforms, notably Databricks, integrate Spark as an execution engine.
Strengths:
Fit context: Spark is an engine, not a complete analytics product. It requires storage, workflow orchestration, and a visualization layer to constitute a complete pipeline, as well as engineers who master cluster configuration, memory optimization, and task debugging. Business teams looking for self-service exploration will not interact directly with Spark.
Ideal for: data engineering teams that design custom transformation and machine learning pipelines at scale.
BigQuery is Google Cloud's serverless data warehouse, designed for SQL analytics without requiring teams to provision or maintain infrastructure.
Storage and computation scale independently of one another, and the pay-as-you-go pricing model bills for queries and stored data rather than reserved capacity. For workloads with variable demand, this makes it possible to align costs more closely with actual usage. BigQuery ML enables model training through simple SQL statements, which lowers the barrier to entry for analysts wanting predictive results without moving data to a separate environment. Market analyses of cloud data warehouses regularly place BigQuery among the essential enterprise solutions.
Strengths:
Fit context: the added value is concentrated primarily on organizations already committed to the Google Cloud ecosystem. In multi-cloud environments, cross-cloud data transfers can generate latency and egress costs. In addition, pay-as-you-go pricing rewards rigorous query writing; teams without financial guardrails (budgets, quotas, or reservations) therefore risk seeing their spending unexpectedly soar. BigQuery supports storage and computation; dashboards and distribution require a separate analytics layer.
Ideal for: organizations using Google Cloud that run ad hoc SQL analyses with variable query volume.
Power BI provides reporting and dashboard creation within Microsoft's cloud and productivity ecosystem, benefiting from close integration with the tools that users already employ daily.
Reports connect to Excel workbooks, Azure data services, and Fabric workspaces with minimal configuration, and semantic models allow teams to define measures only once to reuse them across multiple reports. Sensitivity labels from Microsoft Purview are automatically applied, which helps organizations extend their existing classification policies to analytics. Power BI regularly appears in industry studies devoted to analytics and BI platforms.
Strengths:
Fit context: organizations running a significant share of their workloads on AWS or Google Cloud often find that the richness of connectors and performance optimization are less evident outside Azure. The strength of governance depends in part on the adoption of related Microsoft services, which means that complete governance involves several separate products. Advanced data preparation generally takes place upstream, in Fabric or in a data warehouse, rather than within Power BI itself.
Ideal for: enterprises standardized on Microsoft that want to consolidate their reporting in synergy with their existing investments in M365 and Azure.
Tableau built its reputation on exploratory visual analysis, offering analysts a direct and highly interactive way to query data and build visual narratives.
Drag-and-drop creation makes it possible to design dashboards without code, while live connections to data warehouses allow in-depth explorations on refreshed data. Extracts constitute an in-memory alternative when query performance on the source or costs become problematic. A vast community of practitioners and a rich training ecosystem allow most teams to find help, whatever the envisaged use case.
Strengths:
Fit context: Tableau focuses on the analytics and visualization layer; data integration, pipeline orchestration, and cataloging therefore generally come from separate tools. This technology stack requires coordination between teams and broadens the governance perimeter. Large extracts also require refresh and capacity planning, which shifts part of the operational responsibility onto IT.
Ideal for: teams composed overwhelmingly of analysts whose primary need lies in visual investigation on a preexisting data warehouse.
Qlik adopts a different approach to exploration thanks to its associative engine, which indexes the relationships between all loaded fields instead of following predefined query paths.
Selecting a value anywhere in a Qlik application immediately indicates which associated values are linked to it and, just as usefully, which ones are excluded. This exclusion signal often brings to light gaps that a conventional dashboard conceals. In-memory processing guarantees responsive interactions across all joined sources, and deployment options cover the cloud, the on-premise environment, and hybrid, which helps organizations with mixed infrastructure requirements.
Fit context: The associative model constitutes a true differentiating factor, but it also represents a new mental model for people trained in SQL and conventional BI. Allow for learning time for both developers and end users. Script-based data loading, although powerful, requires technical skills on the development side. Hybrid deployments, for their part, involve their own responsibilities in terms of infrastructure management.
Ideal for: organizations that analyze relationships between many joined sources where predefined reporting paths quickly show their limits.
Snowflake operates as a cloud data warehouse and a data platform, running on AWS, Azure, and Google Cloud with elastic computing power that adapts to each workload.
Independent virtual warehouses allow separate teams to run heavy queries simultaneously without competing for resources, which solves a persistent concurrency problem in shared analytical environments. Secure data sharing allows organizations to grant their partners and customers direct real-time access without copying or transferring files. Support for Apache Iceberg has extended Snowflake to lakehouse-type architectures alongside traditional warehousing.
In practice, Snowflake is frequently associated with an upper analytical layer. All Response Media, a media agency, put in place precisely this configuration. “We use Snowflake for data storage, then Domo as a BI tool for presentation,” said Raj Degun, Director of Technology. Using Magic ETL and Cloud Amplifier, the agency connected more than 170 data sets into a single view of its marketing performance. BI Developer Laura Ziupsnyte observed the result: “What previously took 2.5 days now takes only one hour.”
Fit context: Snowflake handles storage, compute, and governance; it does not provide dashboards nor distribution intended for business users, so a BI or analytics layer completes the setup. Usage-based pricing based on credits rewards query optimization and rigor in warehouse sizing, which assumes that someone takes charge of cost management.
Ideal for: companies needing elastic warehousing with live data sharing between different departments and external partners.
Databricks introduced the lakehouse model, merging the open storage flexibility of a data lake with the transactional reliability and governance expected of a data warehouse.
Engineering, data science, and analytics workloads share a single copy of the data, which eliminates the duplication that occurs when ML pipelines and BI reporting maintain separate repositories. Unity Catalog centralizes access control and lineage across tables, models, and notebooks. Delta Lake and Iceberg provide ACID transactions and time travel on object storage. Databricks regularly appears in analyst studies on data and AI platforms.
Strengths:
Fit context: The platform assumes a reasonably mature data engineering function. Notebooks, cluster configuration, and Spark concepts are part of daily life, which is natural for engineers but constitutes unfamiliar ground for most business analysts. Organizations whose main objective is generalized self-service reporting may find the learning curve steeper than what is required by the category focused primarily on BI, and SQL warehouse endpoints only partially bridge that gap.
Ideal for: teams running machine learning in production alongside analytics on shared and governed data.
Redshift provides SQL data warehousing within AWS, using massively parallel processing to distribute query execution across multiple compute nodes.
Integration with the entire AWS portfolio constitutes its major practical advantage: S3, Glue, Kinesis, SageMaker, and QuickSight connect without complex custom development. Redshift Spectrum queries data residing in S3 without loading it beforehand, which avoids keeping rarely consulted data in warehouse storage. Machine-learning-driven query optimization and result caching adjust performance as workload profiles emerge. Redshift is commonly evaluated by enterprise teams that are standardizing on AWS.
Strengths:
Fit context: Since Redshift is specifically designed for AWS, organizations with a multi-cloud footprint face more integration work than teams operating on a single cloud. Provisioned cluster models require capacity planning, while serverless options shift that burden to consumption management. Analytics intended for business users, dashboards, alerts, and embedded distribution come from a separate layer.
Ideal for: AWS-centered organizations running SQL analytics alongside existing AWS data services.
Azure is a cloud platform rather than a single analytics product, offering storage, processing, machine learning, and BI services that organizations assemble into a technology stack.
Microsoft Fabric groups a large part of this portfolio into a single experience, bringing together data engineering, warehousing, data science, real-time intelligence, and BI around OneLake as a shared storage layer. For organizations committed to the Microsoft ecosystem, this consolidation reduces the number of services to integrate and license separately. Governance relies on Entra ID for identity and Purview for cataloging, classification, and lineage.
Strengths:
Fit context: Breadth is both the major strength and the source of complexity. Choosing among overlapping services, such as Synapse, Fabric, and Databricks on Azure, requires real architectural discernment, and the migration paths between them vary. The advantages are concentrated within the Microsoft ecosystem; thus, AWS or Google Cloud environments will find integration less direct. Fabric capacity-based pricing also requires rigorous planning regarding query concurrency and workload diversity.
Ideal for: companies committed to Microsoft that are consolidating multiple analytical workloads under the same cloud contract.
We developed this list by relying on independent validation rather than on marketing visibility. The selected tools appear in analyst studies covering analytics, BI, and data platforms, show substantiated ratings on review platforms such as G2 and TrustRadius, and demonstrate measurable adoption by companies.
We also took care to deliberately balance its composition. Consolidated enterprise platforms, cloud data warehouses, open-source frameworks, and tools focused primarily on visualization all appear there, because these categories address different issues and buyers have varying levels of maturity in data matters. Each profile covers the same dimensions, notably positioning, fit, strengths, and limitations, in order to guarantee a pragmatic comparison. When a tool benefits from strong recognition in the market, we indicate it in a neutral manner instead of citing precise rankings.
This list is not exhaustive. There are credible options that are not addressed here, notably specialized streaming engines, data catalogs, and regional platforms. The numbering reflects only the order of presentation and in no way constitutes a ranking; Domo appears in first position in accordance with the editorial placement policy, and not as an evaluation of superiority. The inclusion and the contextualization reflect an editorial judgment, and any informed buyer will evaluate the criteria differently according to their own constraints. The functionalities of the platforms also evolve; therefore, be sure to confirm directly with the suppliers the current functionalities, the deployment options, and the pricing structures during your evaluation.
Feature lists rarely make it possible to distinguish among the finalists. What makes it possible to narrow a selection is the fit between a tool's architecture and your workload, your cloud commitments as well as the skills already present within your team.
Start with these criteria:
Data governance often weighs far more heavily in the deployment decision than any dashboard feature. Role-based access control defines who can see and modify what, while attribute-based control applies policies according to the characteristics of the data, such as its sensitivity or its geographic origin. Row-level security makes it possible to offer a single dashboard experience across different regions, business units, or customer accounts, while guaranteeing rigorous segmentation of records. For IT leaders, this capability alone often makes the difference between “we can deploy this at scale” and “compliance requires waiting”.
The quality of metadata is of crucial importance here. At CAE USA, Dave Luna described the stakes plainly: “Beyond that, we hold a lot of sensitive information to which not everyone should have access. Metadata, that is to say data about the data that we integrate into Domo, is essential for maintaining compliance.”
External sharing raises the bar even higher. Open Insurance distributes embedded dashboards to its insurance partners, and Jack Galati, Data Science and Optimization Lead, described this organization: “Domo Everywhere allows us to create a single dashboard, then to share it with many partners. Each partner sees only its own data.”
Also verify automatic data lineage capture, the detection and masking of personally identifiable information (PII), as well as audit logging that records access for the purposes of security investigations and regulatory audits.
Big data analytics tools help organizations adapt to changing market conditions, optimize their operations, and reduce their costs. The benefits appear in specific and measurable areas:
These are results specific to particular customers and not averages; results vary depending on data maturity and the scope of the project.
Regional One Health, a level-1 trauma center in Memphis, operates thousands of cards distributed across 50 dashboards serving care staff, front-line staff, and administrative staff. One initiative targeted pharmaceutical capture, and the results were reflected in the financial statements: the organization increased its pharmacy capture rate by more than 15%, adding $6 million to its net income. “When the project began, about 33% of prescriptions were filled internally. Today, we reach 60% on average, some clinics even managing to fill up to 98% of their pharmaceutical prescriptions internally,” said Teresa Elliott, Director of Planning and Financial Analyst.
Harmons Grocery operates 20 stores in Utah and processes significant volumes daily. “We receive more than one million rows of data every day. Having Domo helps us easily process this information and make it accessible to all of our users,” said Lexi Allsop, Director of Analytics. Cross-referencing sales and HR data to forecast labor needs hour by hour overturned an assumption that no one had questioned: “We notably discovered that many stores make equivalent or greater sales on Sunday, while we were planning our staffing as if Saturday was our busiest day.” In the kitchen, waste of prepared sandwiches went “from 50% to 5% while maintaining well-stocked shelves,” according to Jordan Olson, kitchen manager.
Zippo followed a similar approach on the digital side. “We used Domo to identify cart abandonments observed along our customer journeys. We used Domo to create new journeys in order to remedy them, and we are now recording a 32% increase in revenue from these flows over the year,” said Jenna Buhite, Digital Marketing Strategist.
Origin Bank expanded data access to nearly 250 officers across all of its branches. Adoption swept away the usual skepticism about the actual use of dashboards: from the first month, the officer dashboard was viewed more than 9,000 times.
Rhodes, a frozen dough manufacturer, monitors ingredient tolerances for each batch produced. “With Domo, we can monitor every batch that we produce. We were already doing it, but the information was in spreadsheets and was one week behind. And if a problem arose, it took us a month to detect it. Now, we can identify an anomaly in two seconds.”
At Dal-Tile, a $2.5 billion company, the challenge consisted in reconciling two systems. “With Domo, we can merge our SAP and JD Edwards data and track our spending in real time,” said Joshua Stan, Director of Finance.
Context is decisive, and a few questions make it possible to quickly narrow the field:
Dal-Tile addressed this last question directly, by examining 15 different BI tools before choosing one. "We use it in finance, we use it in manufacturing, we use it in sales and logistics, and we use it in our points of sale," said Joshua Stan. The company started with about 560 Domo users and grew to count more than 1,100.
The finding that deserves to be retained: the winning platform is rarely the one that offers the longest list of features. It is the one that your teams continue to use after the third month. Explore the platform or watch a demo to see how this translates in practice.