Data Visualization Made Easy: Meet Analyzer. Tell Your Story
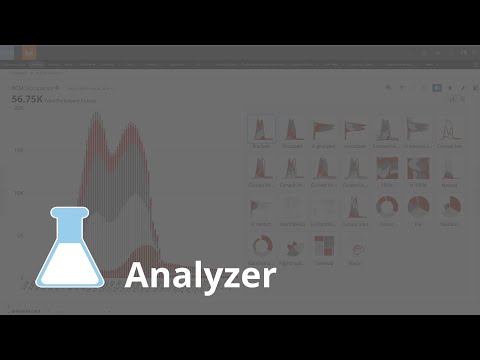
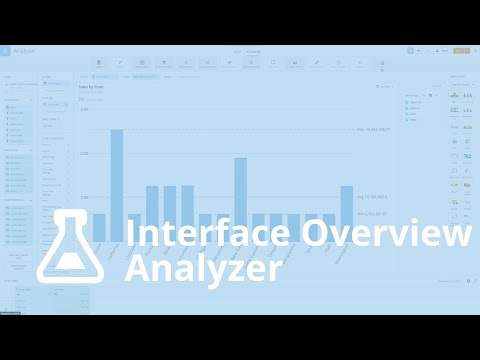
In this video, we delve into the transformative world of data visualization with Analyzer. Learn how data, when effectively presented, can inform, motivate, and inspire change. Analyzer provides over 150 chart types, ensuring your data is never dull and always impactful. From tree maps for hierarchical data to sankey diagrams for tracking customer journeys, find the perfect visual to match your story. Customize every aspect, from tooltips and labels to colors that resonate with your audience. Experience interactive charts that allow you to drill down to record levels, uncovering the stories behind spikes in sales and growth drivers. Plus, explore advanced features like "What If" analysis to test scenarios and strategies. Start telling meaningful data stories today. Check out Analyzer to see how it can elevate your data visualization efforts.
Next video:

Suggested videos: