Rejoignez l'AI + Data Tour pour bénéficier de formations pratiques, découvrir des témoignages clients concrets et échanger avec les experts produits Domo près de chez vous.
Inscrivez-vous maintenant
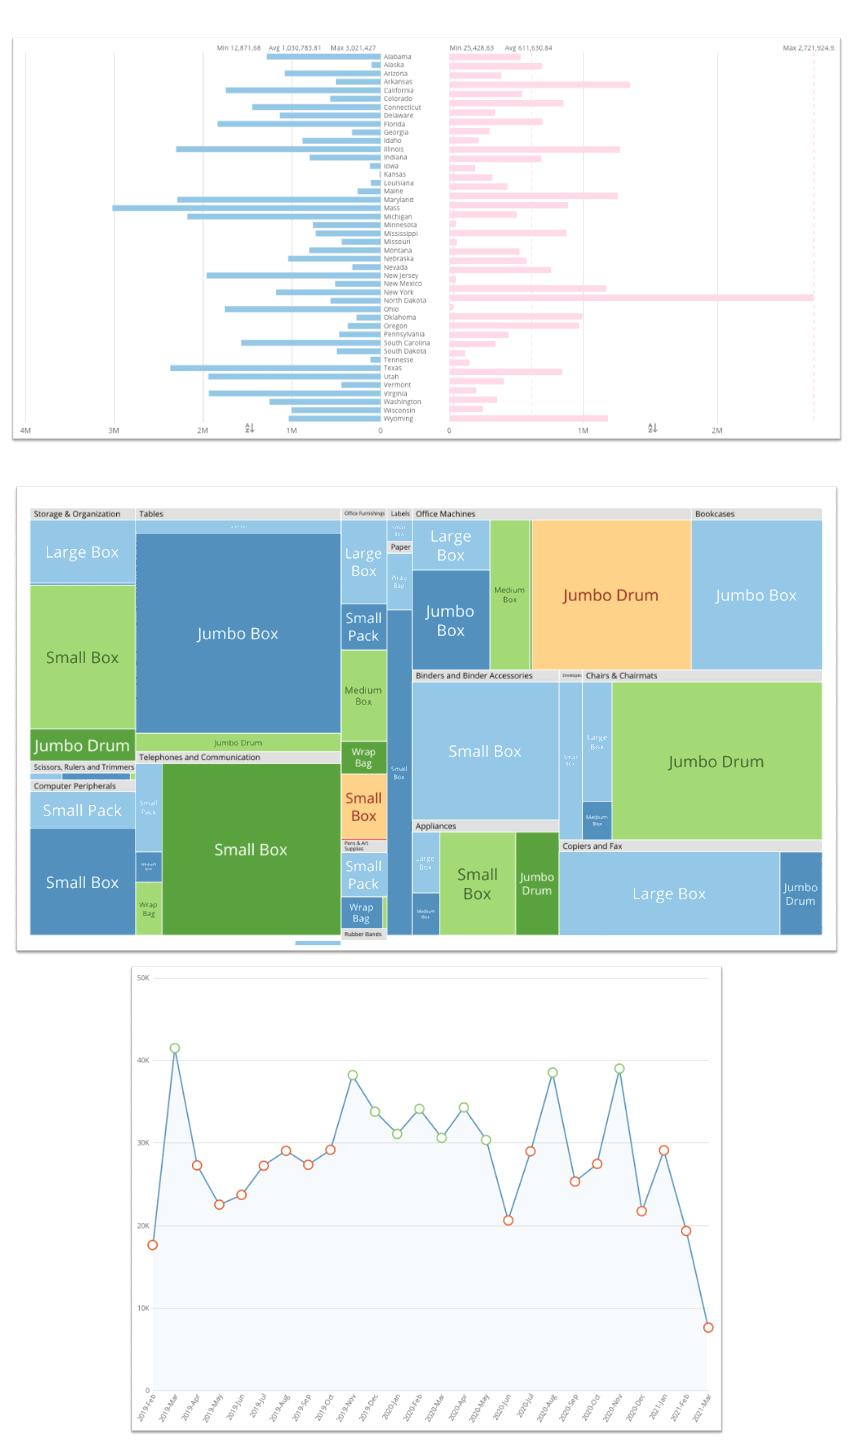
We’ve added new chart types to help you get even more from your data visualizations.
Right-to-left bar charts. In horizontal bar charts, you can now choose whether you want to position the bars on the left or orient the bar chart to the right side. When you choose right side orientation, Domo adjusts the labels, bars, and annotations as well for a seamless look. Right-side oriented charts can easily be coupled with left side oriented charts for more powerful visual insights.
Nested tree maps. Treemaps now have more dimensions to help you analyze more of your business at once. Instead of just having an item and value in your treemap, you can have nested treemaps within a treemap. For example, now you can see not only products and their associated sales in a treemap, but you can also visualize product sales by category and by division in a 3-level nested treemap.
Color rules in line charts. Have you ever wanted to see the sales on a line chart over time with the added detail of seeing whether your data points are above, below, or between certain ranges? Now you can create line charts that apply color rules to each individual point on the line, so you can see the data and understand the performance at a glance.

Domo transforms the way these companies manage business.