Join the AI + Data Tour for hands-on training, real customer stories, and time with Domo product experts near you.
Register now
DOMO FOR PROCUREMENT
Bring clarity to spend, set clear category direction, and turn insight into consistent action across the business as procurement responsibilities continue to grow.
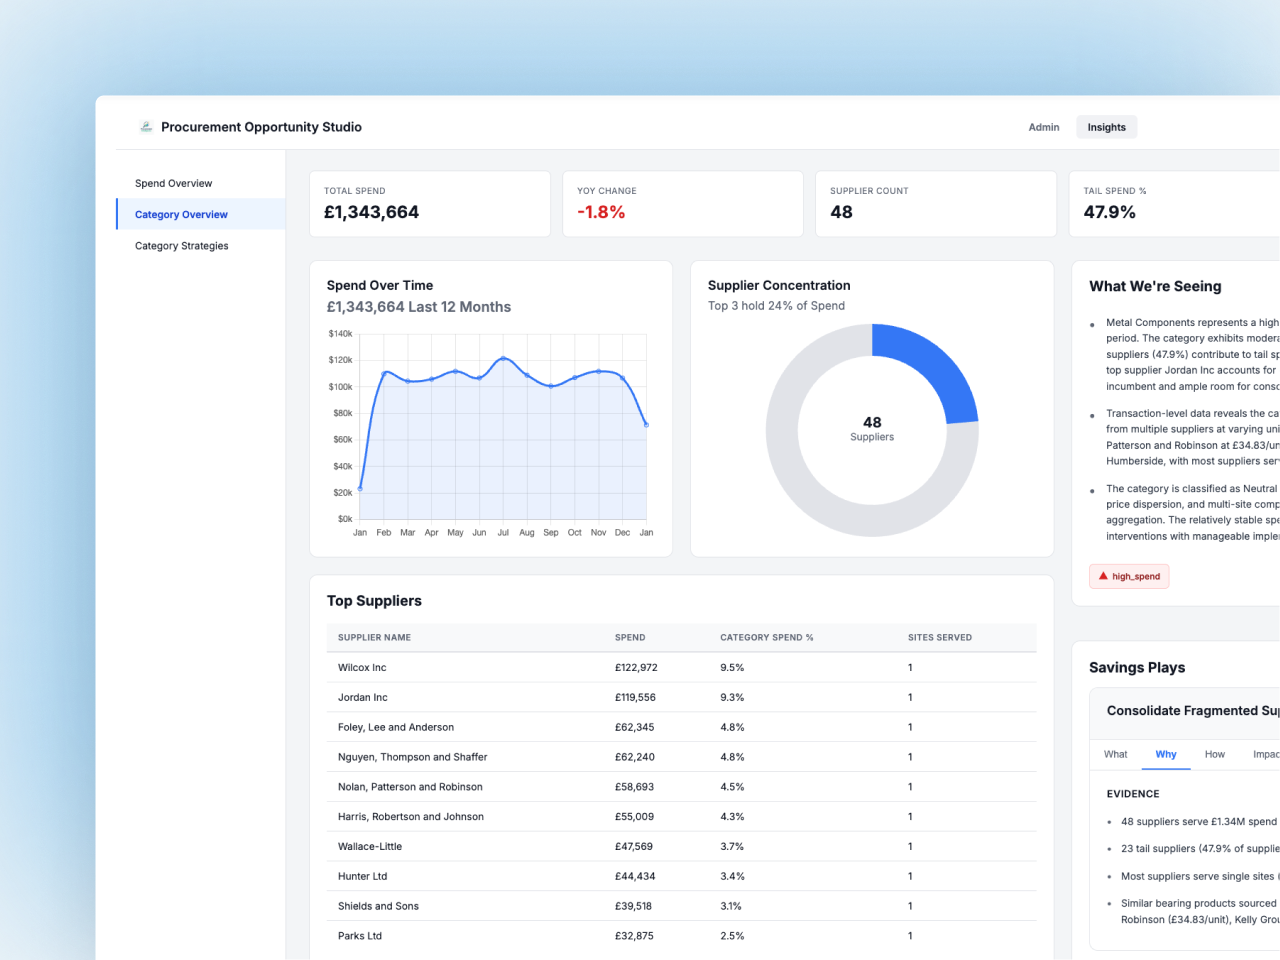

Limited visibility across spend
Unify spend data across systems to see where money goes and where opportunities exist.

Turn fragmented spend data into clear category priorities and savings opportunities.

Turning insight into everyday decisions
Apply category insight consistently to guide how the business buys day to day.

Capacity pressure and rising expectations
Balance day-to-day requests while meeting growing expectations for value, the use of AI, and impact.


Connect to your Procurement data sources
Wählen Sie aus unserer Bibliothek mit über 1.000 Konnektoren, um wichtige Finanzdaten zu verbinden und zu kombinieren.





UNCLEAR CATEGORY PRIORITIES
Seeing spend is only the first step. Domo helps procurement teams move beyond visibility to set clear category direction, identifying opportunities, reducing fragmentation, and focusing effort where it will deliver the greatest impact.
Supported by embedded analytics and real procurement expertise, teams can move faster from data to decisions without relying on spreadsheets or time-consuming manual analysis.


INSIGHT TO ACTION
Insight delivers value when it informs everyday decisions. Domo helps procurement teams embed category direction and policy into purchasing workflows, so insight is reflected in how the business buys, not just how it reports.
AI-driven automation plays a key role here, surfacing opportunities, automating spend classification, and flagging risks to support better decisions without adding manual effort.


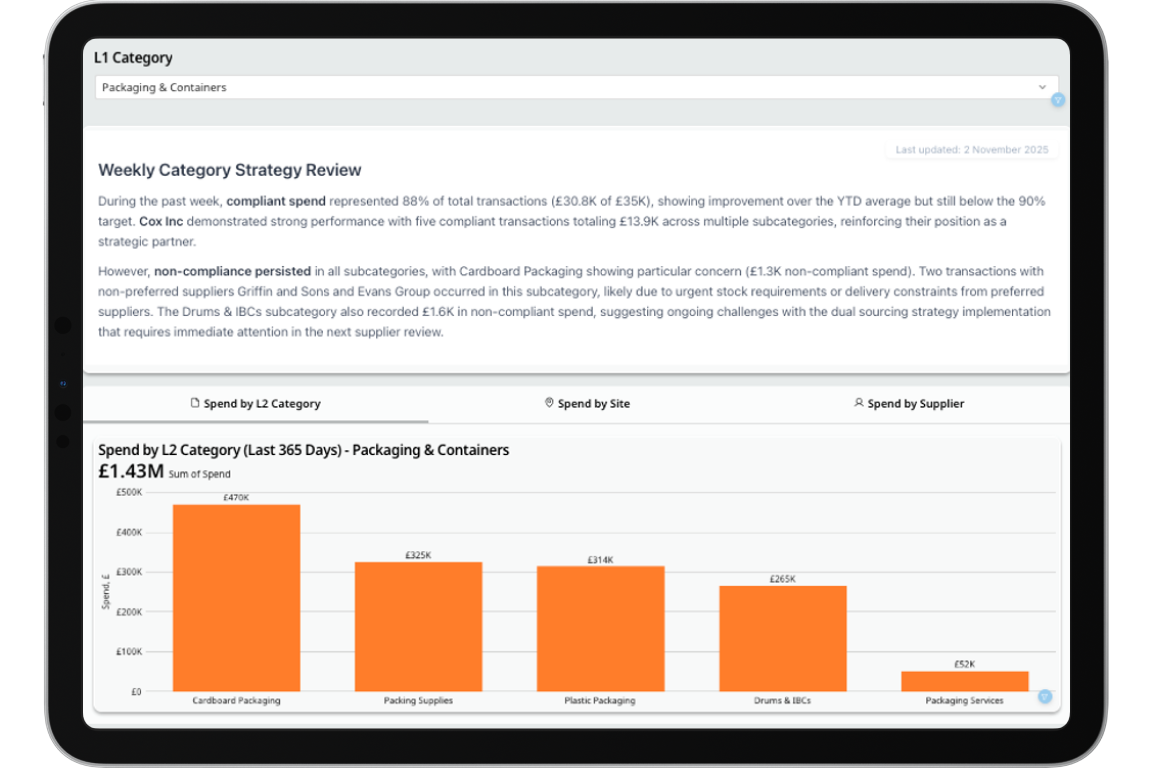
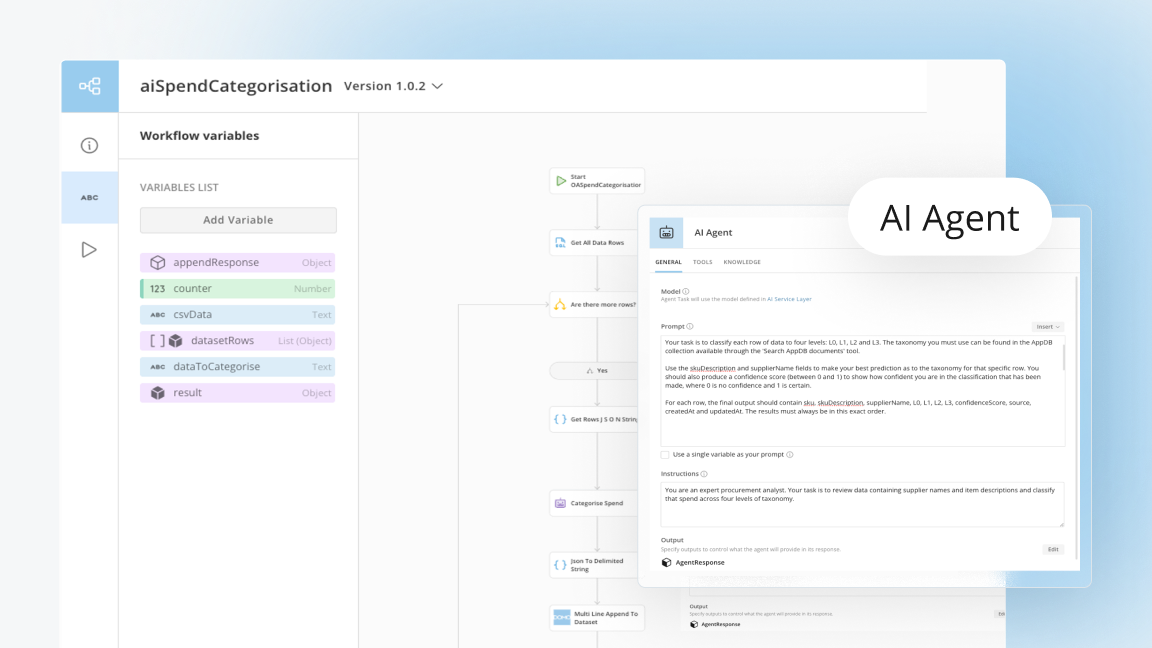
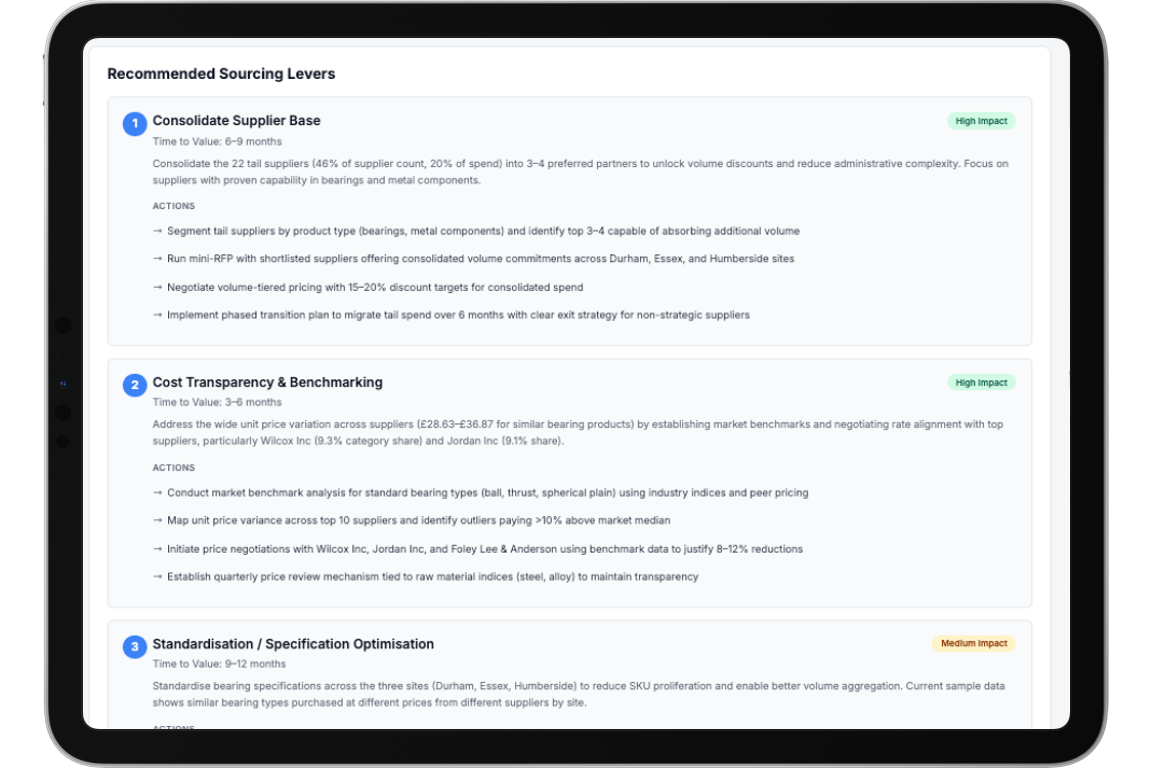
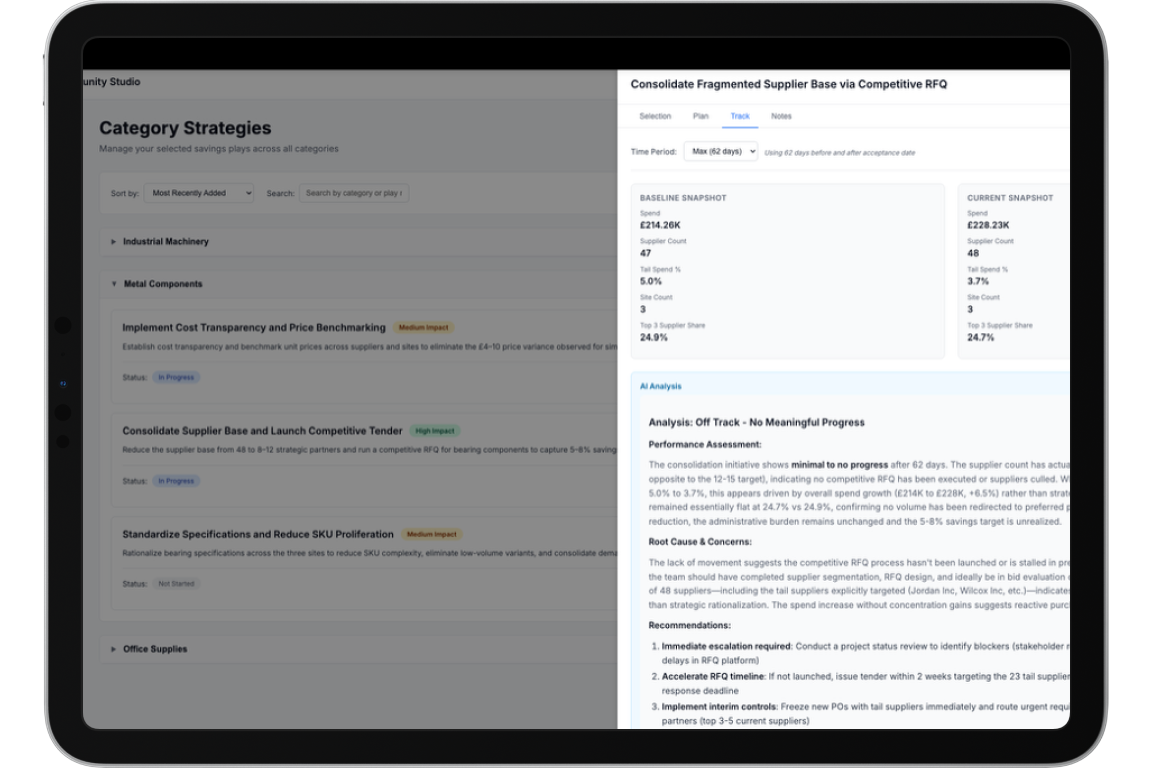
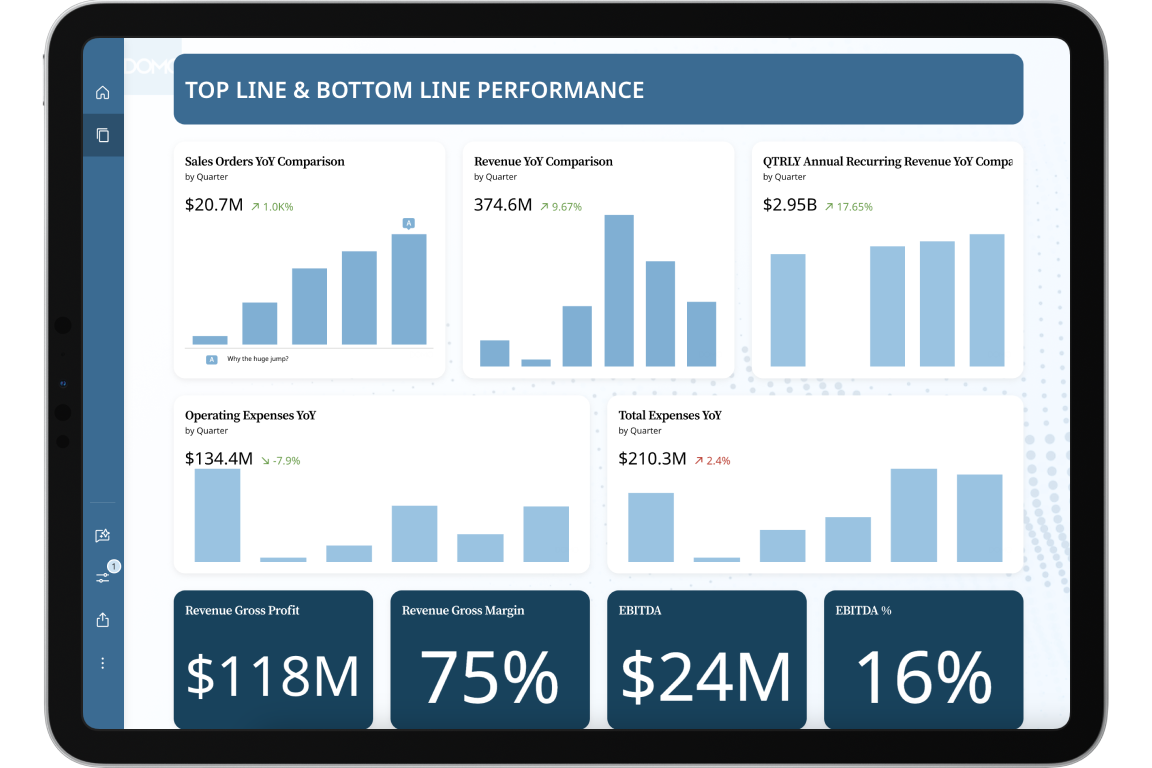
Domo’s Procurement solution combines technology and procurement expertise to help teams move from insight to measurable impact.

● Establish live data connections for real-time spend visibility
● Use automated categorisation to uncover savings opportunities
● Analyse and visualise data to support informed decision-making
● Validate insights and present savings opportunities

● Partner closely to develop strategic sourcing initiatives
● Define clear category strategies
● Identify suppliers and support negotiations or RFPs
● Track and measure savings to demonstrate tangible results