As Bill Russell once said, “The only important statistic is the final score.” But is that still true? In the age Sabermetrics, NFL Pro Days & Combines, ESPN3, Sportvision, Fitbit and Levi’s Stadium, sports analysts have a wealth of information from which they can extrapolate meaning. With all this data available, there will inevitably be several misleading correlations to be drawn.

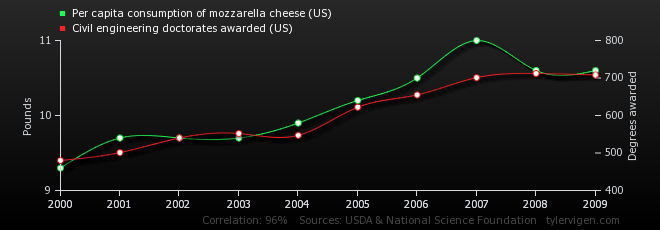
Figure 1: Tylervigens.com provides enough misleading correlations to help you waste a lot of time at work. I’ve distilled that list down to some of my favorites here.
So the real question is, which stats are significant?
Correlation, causation and really bad bets.
The past several months in sports have shown explicitly how experts armed with stat sheets can mistake correlation with causation. From Johnny Manziel’s projected draft position, Bubba Watson winning the Masters, and the Phoenix Suns missing the playoffs, correlations have misled many. Did you know that in the history of the 16-team NBA playoffs, teams with at least a .585 record made the playoffs 99.6 percent of the time? Were you also aware that between 1980 and 2010 no one had won the Masters while buttoning up each button on their polo shirt?

Figure 2: The data doesn’t lie—or does it? Cheese consumption is directly correlated to death by bedsheet strangulation.

Figure 3: But don’t worry—cheese-eaters also earn their civil engineering degrees before succumbing to nefarious 600-count spreads.
The layperson might take those numbers to Vegas; however, without all the information, it’s very difficult to determine whether your stats are significant. In the world of 1s and 0s, what’s the difference between buttoning up your polo shirt and using graphite driver shafts?
Access to the right data matters.
Whether in the coach’s office or the executive’s office, leaders need access to all their pertinent data to determine important and irrelevant relationships. Is an NBA team missing the playoffs because of injuries mid-season or because of increased 3-point shooting in divisional road games? Are a company’s sales increasing because they’re spending more on billboards and print ads, or because the PR team has increased their news article mentions? Did a player not get drafted until the 24th pick because he blasted rap music on his Pro Day or because several footballs with his autograph showed up on eBay?
All questions are difficult to answer unless all the data can be brought together.
Domo helps you clear the misconceptions.
This is where Domo comes in. The ability to combine disparate data sources into a unified platform allows decision makers to ask tough questions and get accurate answers—answers which were previously unattainable. This type of wide ranging analysis can help you avoid surprises in the boardroom, and anywhere it may count. No matter the profession, each professional deserves the data analysis tools of the pros. Otherwise, we may be left to project increasing oil imports by per capita consumption of chicken, all in the name of misleading correlations.
