@JoshJames: Wow!! @jimmerfredette had the best game [of] his career!! Dropped 24 on the Knicks. Leads NBA in 3 pt % http://t.co/AHcSd6emCS
If you’ve been keeping up with our blog recently, you can tell two things: we’re data geeks, and we love sports. I’m beginning to think it’s because sports give us an opportunity to satisfy our data addiction without looking like we have a data addiction.
Me, I’m no sports guy. I prefer reading a book over watching a game any day. But as I was catching up on some news about Jimmer Fredette, the NCAA 2011 Player of the Year from my alma mater (BYU), I couldn’t help but geek out over some stats.
The guy’s having a bum start to his NBA career. The casual observer might say, “He’s lousy on defense, and his points per game are going down. Why play him?” His scoring numbers have declined along with his time on the court—from 18+ minutes per game and 7.6 points, to now 11.3 minutes per game for 5.9 points. The Sacramento Kings are desperate to win a game, and they need bigger plays than just 5.9 points. And on top of all that, Fredette is only 6’2” and he struggles to defend. To most, that’s where the analysis would end. No Fredette.
But there’s more to the data—way more. Let’s compare Jimmer Fredette to a guy named Steve Nash. Steve Nash became a two-time MVP, and even for those of us more familiar with iambic pentameter than effective field goal percentage, you know that’s gotta be something good. Here’s how the data says Jimmer Fredette stacks up against Steve Nash apples-to-apples:

Let’s get a little more granular:
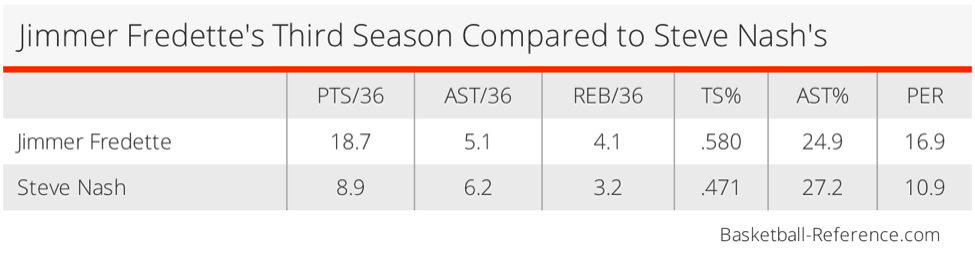
I didn’t understand the chart at first, so here’s a breakdown: Fredette’s player effectiveness rate (PER) in his 3rd season is 16.9—and the NBA average is only 15. So not only is Fredette 60% higher than Nash at the same point in his career, but he’s also statistically, undeniably above average.
As stated earlier, his minutes played (MP) decreased from over 18 to now 11.3—a reduction of roughly 42%—but his points only went from 7.6 to 5.9, or only a drop of 15%! That means Jimmer is wildly efficient, now making a little more than one point every two minutes (or 15 points in six minutes during his game against the Knicks). That’s a stat backed up by his true shooting percentage (TS%), which is at times almost 20% higher than Nash’s.
Despite all of that, they’re not playing Fredette.
Hey, maybe if the folks in Sacramento had better access to the right data, they’d win a few more games. If only I had a nickel for every time a business leader said the exact same thing about their data.
The only question that remains is this: How do you get access to that kind of data when you need it? Whether you’re a coach or a business leader, you don’t have time to put numbers together and mix and match on spreadsheets. Sure, you have reports (and ESPN) for that, but there’s got to be an easier way.
Look, it’s the 21st century. There is a way. If you can get real-time updates on friends’ Instagram photos of their meals, you should be able to get real-time business data in a single dashboard. It shouldn’t be something spectacular. It should just be expected.
How do you get the business data you need? And am I just a fan boy, or do you see as much potential in Fredette as I do?